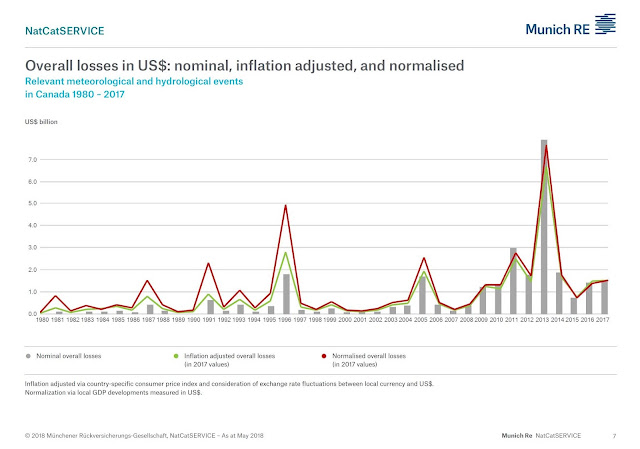
Munich RE's NatCatSERVICE provides information on relevant and catastrophic losses. Insured and uninsured losses are tracked for various events including hydrological events (floods, flash floods, severe storms) and meteorological events (hurricanes, storm surges, floods). Charts showing trends in losses are available from 1980 to 2017 expressed in 2017 $USD including:
- Nominal Overall Losses - values as they originally occurred
- Inflation Adjusted Losses - accounting for changes in monetary equivalent
- Normalized Losses - accounting for growth of values and assets (considering nominal gross domestic product)
 |
| Normalized Flood Losses - Relevant Hydrological Events in North America 1980-2017 per Munich RE NatCatSERVICE |
 |
| Normalized Flood Losses - Catastrophic Hydrological Events in North America 1980-2017 per Munich RE NatCatSERVICE |
The normalized, inflation-adjusted losses for hydrological events have peaked in 1990's, e.g., due to the Great Flood of 1993. How about considering the 2017 hurricanes experienced? The losses of Hurricane Harvey, Maria, and Irma are tracked as meteorological events as shown in the following charts:
 |
| Normalized Flood Losses - Relevant Meteorological Events in North America 1980-2017 per Munich RE NatCatSERVICE |
 |
| Normalized Flood Losses - Catastrophic Meteorological Events in North America 1980-2017 per Munich RE NatCatSERVICE |
Data shows that relevant and catastrophic losses peaked in 2005 due to Hurricane Katrina. Actual, unadjusted losses were higher in 2017 than in 2005, but when adjusted for inflation 2005 losses were near 2017 values - and when GDP growth is considered, 2005 values exceed 2017.
It is common for losses to be reported without adjustments. Making adjustments to normalize losses considering growth in net written premiums (i.e., higher losses are expected with growth in insurance market - more policies, more premiums, more payouts and claims). This was explored in my paper published earlier this year:

Where unadjusted losses, shown at right, suggest a significant increasing loss trend, adjusted losses, shown below, do not indicate a significant increasing trend.
 |
| Catastrophic Losses Adjusted for Growth in Net Written Premiums in Canada - per Robert Muir's Thinking Fast and Slow on Floods and Flow. |
The Geneva Organization's recent report Understanding and Addressing Global Insurance Protection Gaps illustrates changes in uninsured losses as a share of Gross Domestic Product (GDP). As stated in the report: "Over the past three decades, the share of worldwide uninsured losses in global GDP
has decreased from 0.31 to 0.19 per cent. For high-income countries, the share fell from 0.20 to 0.13 per cent. Upper middle-income countries show a reduction from 0.21 to 0.11 per cent". The significant decreases appear small on the chart, due to the logarithmic scale on the y-axis.

***
More resources? The initial charts above were from reports prepared using the online NatCatSERVICE.
This is a link to the Munich RE NatCatSERVICE report on North American losses from hydrological events: Hydrological Losses North America 1980-2017
Similarly, this is a link to the report on those losses from meteorological events: Meteorological Losses North America 1980-2017
***
How about Canadian trends? The following NatCatSERVICE chart was provided by Munich RE specifically for Canada. It shows some increasing trends in losses after accounting for inflation just as the chart above with Canadian catastrophic losses normalized by growth in net written premiums.
***
How about Canadian trends? The following NatCatSERVICE chart was provided by Munich RE specifically for Canada. It shows some increasing trends in losses after accounting for inflation just as the chart above with Canadian catastrophic losses normalized by growth in net written premiums.
Looking at data from the Insurance Bureau of Canada including loss data and net written premiums, we see both of these values increasing in recent decades as shown below.

The following charts show catastrophic losses vs net written premiums, and catastrophic waster losses vs net written premiums. To smooth out variability in annual losses, a 5-year moving average is used in the charts.


Other factors affect risks and losses. Urbanization is a key factor increasing runoff and risks and this has been documented in key case law in Ontario (see previous post with factors). That is, hydrologic stresses increase due to the expansion of urban areas and the intensification of development within urban areas. Other factors include hydraulic constraints in infrastructure systems that can degrade over time - these include natural factors such as blockages of sewer pipes due to build-up of calcite, sediment, roots, FOG (fats, oils, grease), or engineered modifications to collection systems that hold back wastewater flow during wet weather to prevent spills in watercourse - these modifications can in some cases aggravate back-up risks in the wastewater collection system.
Factors such as increasing rain intensity and frequency have been suggested by some however, Environment and Climate Change Canada data (see previous post on version 2.3 Engineering Climate Datasets, and new version 3.0 datasets), numerous regional studies (see compiled engineering and research reports), and the CBC Ombudsman findings (see January 2019 findings on extreme storm reporting), supported by Environment and Climate Change Canada data, all indicate no change in extreme rainfall.
***
Also see previous post - Catastrophic Losses in Canada - Have Flood Damages Increased Significantly Or Have Changing Data Sources Affected Trends?
***
The Government of Canada has found that the majority of loss increases have been due to growth, and climate change 'may' be having an effect - this is reiterated in the just-released Canada in a Changing Climate: National Issues Report (see post: https://www.cityfloodmap.com/2021/06/national-issues-report-identifies.html). Canadian loses have been normalized for growth show a moderate increase over time - the report notes that earlier data may be incomplete, which would affect the normalized trend.