There is perpetual contradictory information on extreme rainfall frequency trends in the media. The prevailing statement is that weather is more extreme due to climate change and underlying global warming that increases the atmosphere's water vapour and capacity and to rain. A
previous post has shown that the relationship between temperature, water vapour and extreme rainfall does not 'hold water' - that is a high temperatures, researchers at MIT and Columbia have not observed higher rainfall intensities as predicted by theory.
What about
observed rainfall intensities and the extreme value statistics derived from them? This posts takes a deep dive into southern Ontario 100-year rainfall intensity trends in southern Ontario, focusing on Environment and Climate Change Canada's long term climate station records. The finding is that there is no prevailing increase in extreme rainfall intensities in southern Ontario and that generalized safety factors in design (say 20% buffer) can accommodate the effect of recent extreme events.
Some background information and notes:
 |
| Southern Ontario Annual Maximum Series Trends |
i) Environment and Climate Change Canada (ECCC) reports trends in raw observed rainfall extremes - these annual maximum series (AMS) trends and their statistical significance were reviewed in a
previous post. In brief, in southern Ontario there were more than twice as many statistically significant decreasing trends in raw observed extremes as increases, as shown in the table to the right.
 |
Canadian Long Term Climate Station Annual Maximum
Recorded Rainfall Trends |
ii) ECCC derives IDF statistics from the raw data and updates IDF curves and IDF tables from time to time. These statistics characterize the average and extreme intensities that engineers and design professionals can consider in sizing new infrastructure or remediating old infrastructure. The 100-year rainfall intensities (100 year "return period") are those we can expect with a 1-in-100 or 1% chance per year - this post reviews those extreme trends for short and long durations, but only stations with more than 45 years of record are used since its good practice to not estimate statistics too far beyond the record length. So the 7 Ontario stations in the table at right are reviewed - out of all the 5 minute to 24 hour trends in the table, these southern Ontario stations have increasing trends in only 30% of the maximum rainfall observations.
iii) The raw data and derived IDF data are called the "Engineering Climate Datasets". Five versions of this data were reviewed (pre v1 data up to 1990 obtained from ECCC archives, v1 data up to 2003, v2.2 data up to 2007 and v2.3 data up to 2013). This data is
available on ECCC's ftp site with the exception of the pre v1 archives. The ftp link to Intensity-Duration-Frequency (IDF) Files is
ftp://ftp.tor.ec.gc.ca/Pub/Engineering_Climate_Dataset/IDF/
iv) The Canadian Standards Association published
PLUS 4013 (2nd ed. pub. 2012) - Technical guide: Development, interpretation and use of rainfall intensity-duration-frequency (IDF) information: Guideline for Canadian water resources practitioners which indicates how extreme events could be considered in IDF curve updates and frequency assessment of those events. The guide notes "If an observation of the event is available from an IDF location, update the IDF calculations using the event and all subsequent years since the most recent update (not including intervening or subsequent years will bias the calculation)". The data below does not always meet this requirement to include subsequent years and so some statistics are noted to be potentially biased (i.e., statistics shifted by a large recent event).
v) To look back at
pre-pre-version 1 rainfall intensities, statistical analysis of annual maximum data up to 1980 was completed assuming a log-normal distribution to estimate the 100 year statistics prior to and including 1980.
Short Duration 100-Year Rainfall Intensity Trends in Southern Ontario - 5 Minutes to 1 Hour
The following two charts show the 5 minute and 1 hour duration trends in IDF curve data from pre-version 1 to version 2.3 Engineering Climate Datasets. Only the Toronto International Airport (Pearson Airport in Mississauga, Ontario) has data updated in version 2.3 including 2013. These charts represent the rainfall intensities that govern urban infrastructure design - some large trunk sanitary sewer systems may be governed by longer duration volumes and intensities but most storm drainage systems will be most sensitive to short duration rainfall given the quick response time and flashiness of urban catchments (i.e., short catchment 'time of concentration' means the short duration IDF intensities govern).
 |
| 5 Minute 100 Year Rainfall Intensity Trends - IDF Curve Updates in Environment and Climate Change Canada's Engineering Climate Datasets for Southern Ontario Long Term Climate Stations (Windsor, St. Thomas, London, Mississauga (Toronto International Airport / Pearson), Toronto, Kingston, and Ottawa). |
 |
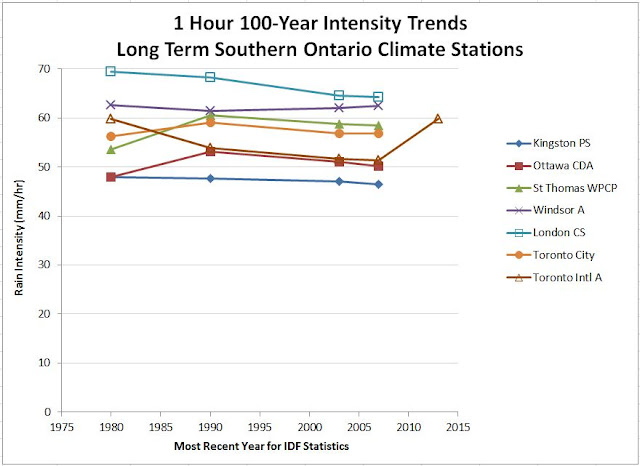
| 1 Hour Minute 100 Year Rainfall Intensity Trends - IDF Curve Updates in Environment and Climate Change Canada's Engineering Climate Datasets for Southern Ontario Long Term Climate Stations (Windsor, St. Thomas, London, Mississauga (Toronto International Airport / Pearson), Toronto, Kingston, and Ottawa). |
The short duration trends show overall decreasing 100-year 5 minute rainfall intensities for most stations. It is noted that the Kingston Pumping Station and Ottawa CDA climate stations have decades of continuously missing data and sporadic data in the early to mid 1900's. The July 8, 2013 storm in Mississauga/west Toronto increased the 5-minute intensity slightly, and increased the 1 hour 100 year intensity back up to pre-1980 levels. It is questionable whether the 2013 storm should be included in the IDF update based on the CSA guide approach. Including it can bias the record however it does not increase IDF curve values above earliest statistics so it could be maintained considering that it would not affect design standards based on earlier rainfall statistics for short durations.
The 1 hour duration 100 year IDF trends are mixed, with more decreases than increases progressing from 1980 to 1990. After 1990, there are more decreases than increases as well.
This suggests that drainage design standards based on earlier raw maximum rainfall observations (AMS's) and derived extreme rainfall IDF statistics, particularly short duration rare, 100-year intensities, are conservative considering today's climate, as defined by the most recent AMS and IDF curve data in the Engineering Climate Datasets.
Since drainage design incorporates safety factors, just like any other infrastructure, an allowance of 20% higher intensity to 'stress test' system performance could be considered in southern Ontario systems to account for future climate change uncertainty or the effect of significant events, even if they are considered statistical 'outliers' in the CSA IDF guide approach.
Since IDF curve data is only one input to hydrologic analysis and hydraulic infrastructure design, safety factors and resiliency in other design aspects could be considered before applying any IDF safety factor, especially where there are significant capital or lifecycle cost implications - e.g., are runoff coefficients conservative, accounting for intensification post-design, are conservative hyetographs used in simulations, are inlet control devices used to mitigate the effect of higher IDF curve intensities on storm sewer systems, is there adequate freeboard on major overland drainage systems to accommodate higher rainfall, etc.?
Moderate to Long Duration 100-Year Rainfall Intensity Trends in Southern Ontario - 6 to 24 Hours
IDF curve 100 year rainfall intensity trends for longer duration of 6 to 24 hours are summarized in the two charts below.
The 6 hour intensities show a consistent increase from 1980 to 1990 and mixed trends from 1990 to 2007. Statistics can be affected by single events (Mississauga/Toronto Intl A in 2014, or Ottawa CDA in 2004).
Generally, if a 20% safety factor is available, most systems could accommodate even the higher intensities that consider single extreme 'outlier' events - for example, Toronto and GTA or GTHA standards based on 1990 data, say 13.4 mm/hr at Toronto City (Bloor Street station ID 6158350) or 15 mm/hr at Toronto Intl A (Pearson Airport station ID 6158733) plus 20% would yield 16-18 mm/hr extreme weather 'stress test' intensities. Such values would be above the July 8, 2013 influenced 100 year intensity, meaning systems designed with the 20% design buffer would be resilient for design intensities considering larger storms as well. In Ottawa, adding 20% to the 1990 6 hour 100 year intensity of 13 mm/hr (station ID 6105976) would give a 15.6 mm/hr 'stress test' intensity which is also above the 2007 updated IDF intensity that considers the significant September 9, 2004 storm. Ottawa, in fact, already considers such as 20% design stress test -
see slide 28 in this presentation.
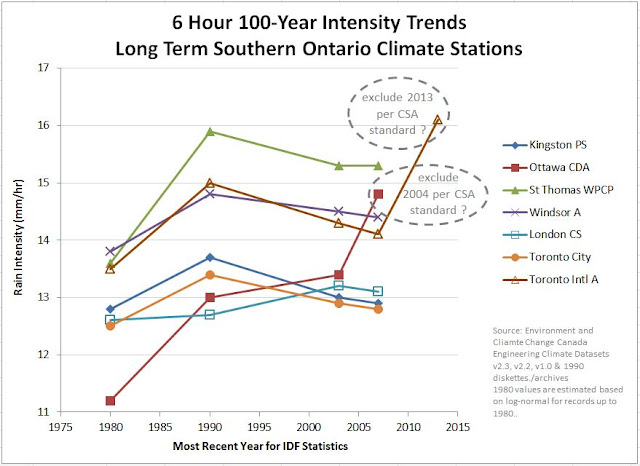 |
| 6 Hour 100 Year Rainfall Intensity Trends - IDF Curve Updates in Environment and Climate Change Canada's Engineering Climate Datasets for Southern Ontario Long Term Climate Stations (Windsor, St. Thomas, London, Mississauga (Toronto International Airport / Pearson), Toronto, Kingston, and Ottawa). |
 |
| 24 Hour (Daily Total) 100 Year Rainfall Intensity Trends - IDF Curve Updates in Environment and Climate Change Canada's Engineering Climate Datasets for Southern Ontario Long Term Climate Stations (Windsor, St. Thomas, London, Mississauga (Toronto International Airport / Pearson), Toronto, Kingston, and Ottawa). |
The 24 hour IDF curve trends in southern Ontario are similar to the 6 hour trends with increases from 1980 to 1990 and a mix of decreases and increases since 1990. Increases occur when recent extreme events are factored in (2013 in Toronto and 2004 in Ottawa). Again, a 20% buffer on 1990 IDF intensities would generally cover the increase due to extreme 'outlier' events. Infrastructure systems that are sensitive to storage volume over long durations such as stormwater detention ponds could be reviewed based on the 20% stress test, not necessarily to alter design, but to test system performance in terms of surcharge risk in the upstream collection system, freeboard on spillway / overflow features, or cumulative changes to downstream floodplain limits (if the system is governed by return period storm as opposed to regional storm hurricane events, etc.).
Conclusion
With regular media reports echoing The Day After Tomorrow storm-apocalypse predictions when there are high lake levels that are
not significantly above historical extremes, and Al Gore's Inconvenient Sequel providing alternative facts on hurricane frequency that, up until Hurricane Harvey, have been clearly decreasing in
number of landfalls and GDP-normalized damages, there is a need to dig below the headlines, take advantage of Open Data and check if data really supports the headlines. Prime Minister Trudeau recently
declared in Gatineau that we will have 100 year storms every few years, which data from Environment and Climate Change Canada (ECCC) does not support. ECCC routinely correct insurance industry statements on extreme weather trends like in
this Canadian Underwriter article where IBC claimed storms were more frequent and ECCC issued this correction:
"Associate Editor’s Note: In the 2012 report Telling the Weather Story, commissioned to the Institute for Catastrophic Loss Reduction by the Insurance Bureau of Canada, Professor Gordon McBean writes: “Weather events that used to happen once every 40 years are now happening once every six years in some regions in the country.” A footnote cites “Environment Canada: Intensity-Duration-Frequency Tables and Graphs.” However, a spokesperson for Environment and Climate Change Canada told Canadian Underwriter that ECCC’s studies “have not shown evidence to support” this statement."
The IDF trend analysis above for southern Ontario long term climate stations supports the ECCC statement that there is no support for insurance industry claims - there is certainly no 40 year to six year frequency shift in 100 year rainfall intensities. A similar ECCC correction was made on Windsor area trends in a
CBC News article, where an insurance broker stated "we're getting 20 times more storms now than we were 20 years ago.", and in response to a complaint (mine) CBC checked with ECCCcorrected the article adding
"However, Environment Canada says it has recently looked at the trends in heavy rainfall events and there were "no significant changes" in the Windsor region between 1953 and 2012."
Looking at the official data from 1990 and scaled to zero to put changes in perspective, the ups and down do not look dramatic overall. Below are those 5 minute, 1 hour, 6 hour and 24 hour 100 year IDF trends. It suggests we should "Keep calm and carry on"... especially if you have a 20% design buffer.



So some regions in Canada may have overall increasing trends in extreme rainfall (see second table of long term Canadian AMS trends), but southern Ontario does not appear to be one of them based on IDF data trends. This suggests that infrastructure that is designed or upgraded to 1990 IDF standards (i.e., pre ECCC version 1 Engineering Climate Datasets obtained from archives for this post's review) is largely resilient to today's climate, as there has been little change. Sensitivity to future, predicted IDF changes would be the next step in creating resilient infrastructure - it may be that upgrades to meet even the 1990 IDF 'weather' with a nominal safety factor will result in adequate climate adaptation co-benefits, depending on the resiliency in other hydrology and hydraulic analysis and design.


