Showing posts with label risk. Show all posts

Future Extreme Rainfall IDF Values in Canada Include Decreasing Intensities for Some Emissions Scenarios and Regions

 A research paper Assessment of non-stationary IDF curves under a changing climate: Case study of different climatic zones in Canada in the August 2021 Journal of Hydrology: Regional Studies by Silva et al. projected future IDF curves in several regions of Canada under various emissions scenarios (link: https://www.sciencedirect.com/science/article/pii/S2214581821000999). A previous post discussed historical annual maximum rainfall at climate stations with long-term records and noted stationary values for several stations and rainfall durations (i.e., no change in annual extreme rainfall observations) - see post: https://www.cityfloodmap.com/2021/12/has-extreme-rainfall-become-more-severe.html.

The paper presents changes in typical design intensities for:

i) 120-minute (2-hour) 5-year return period values (e.g., along with intensities for shorter durations, these data are used to design storm sewers in many jurisdictions), and

ii) 1440-minute (24-hour) 100-year return period values (e.g., used to design stormwater detention facilities, or used to derive design hyetographs for floodplain mapping in some watersheds and for RDII analysis in some wastewater collection networks prone to wet weather impacts, etc.).

Future projections are made for the period 2020-2100. The main paper presents percentage changes for the RCP8.5 emissions scenario as follows:


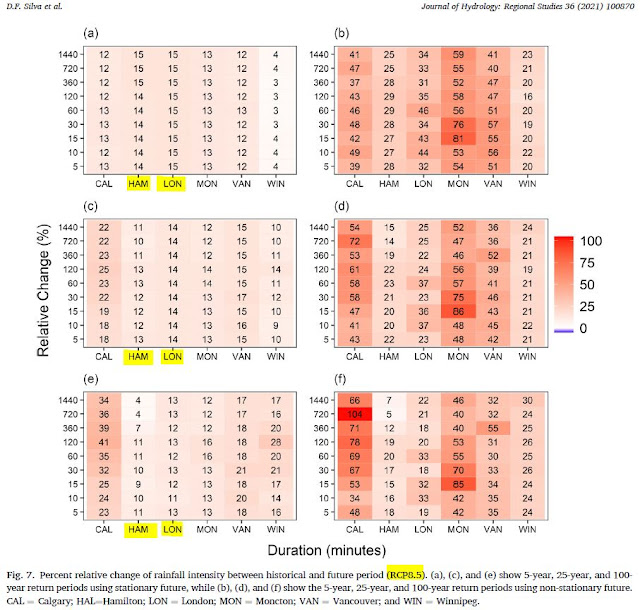
The charts on the above left show changes for stationary distributions, and Hamilton (HAM) and London (LON) columns are highlighted. Those stations were shown to have stationary annual maximum extreme rainfall in the paper, as shared in the previous post. The London and Hamilton 100-year rainfall intensities increase from 4 to 13 percent under the RCP 8.5 emissions scenario (stationary table on the bottom left). 

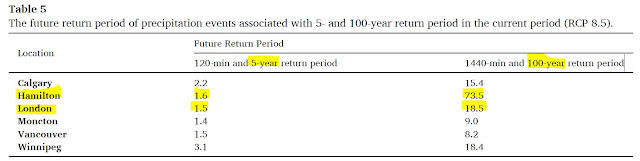
Under the RCP8.5 scenario the return period of today's 100-year 24-hour becomes smaller, meaning that intensity can occur more frequently than the 1% chance per year today. Today's 5-year 2-hour intensities become more frequent as well. The paper shows these projected intensities: 


So a 100-year return period 24-hour (1440 minute) intensity becomes a 73.5 year return period intensity or a 18.5 year return period intensity in Hamilton and London, Ontario, respectively.

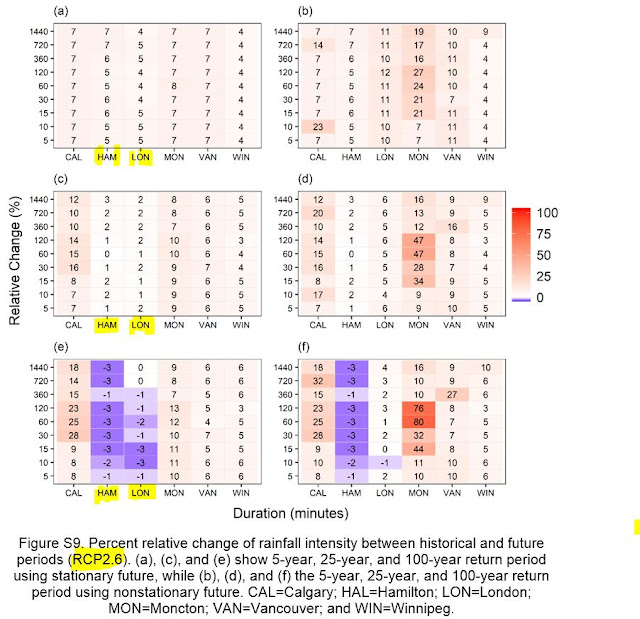
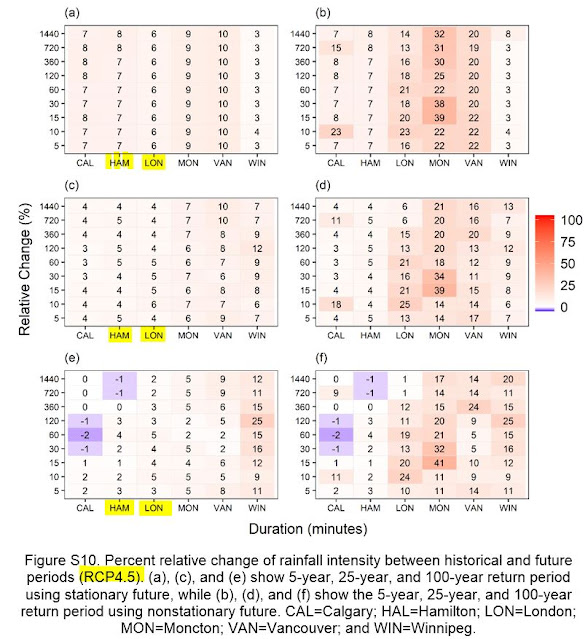
Supplemental material shows that for other emissions scenarios intensities do not increase
at these Great Lakes climate stations for the rare 100-year intensities. See below:

For a RCP2.6 scenario, the 100-year intensities in the table (again on the bottom left for the stationary model), decrease by 3 percent or are unchanged. With those decreases the return period of today's design intensities become longer, meaning today's intensities are less frequent. That means reduced risks for extreme rainfall compared to today.

The RCP4.5 scenario projected 100-year intensities are essentially unchanged in Hamilton and up slightly in London: 


So what are future rainfall intensities in Southern Ontario? That depends on the emissions scenario you select.

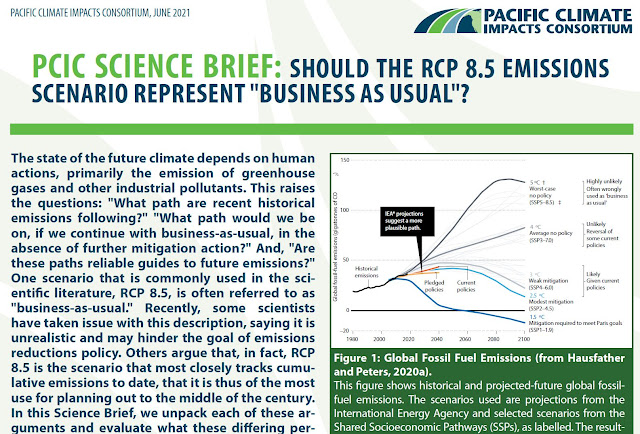
Recently the Pacific Climate Impacts Consortium questioned if RCP8.5 should be considered as 'business as usual', that is, is it the most likely future scenario? See a detailed discussion in their Science Brief: https://www.pacificclimate.org/sites/default/files/publications/Science_Brief_39-June_2021-final.pdf, an excerpt which is below.


The Science Brief concludes that:

"Given that RCP8.5 is not the most "likely" outcome of emissions following business-as-usual or stated policy intensions, its reasonable to refer to it as a high emissions scenario instead of business-as-usual."

A previous post also noted that others have also questioned the validity of RCP8.5:


ii) Roger Pielke Jr. and Justin Ritchie as reported in Issues in Science and Technology (https://issues.org/climate-change-scenarios-lost-touch-reality-pielke-ritchie/). 

Therefore, the paper's projections for future intensities under RCP8.5 could be considered in stress tests of infrastructure or hydrologic systems. Such tests can identify low-regret design modifications that can be incorporated initially, or to identify future adaptive management if modifications today would be too costly and yield uncertain and limited benefits (i.e., based on the limited likelihood of such severe intensities occurring with less likely scenarios). Assessment of most-likely conditions should consider projected future intensities based on emissions under stated policy intentions, such as presented in the paper's supplemental material (e.g., RCP4.6).

Both the US Federal Highways Administration (FHWA) and the American Society of Civil Engineers (ASCE) have developed risk-based approaches to designing infrastructure for future climate conditions. 

The Canadian government describes a method for projecting future rainfall intensities based on temperature-scaling, considering RCP4.5 and RCP8.5 (see previous post  https://www.cityfloodmap.com/2021/12/adjusting-idf-curves-to-account-for.html). The approach notes one should:
  • Apply risk-based decision-making to choose the future extreme rainfall value that is most appropriate for asset risk thresholds.  For example, if rainfall consequences to infrastructure are severe, consider applying upper end of projected future RCP 8.5 1-hour 1-in-100-year rainfall intensities to infrastructure design.
A robust risk-based approach could also consider other scenarios such as RCP2.6 as well.

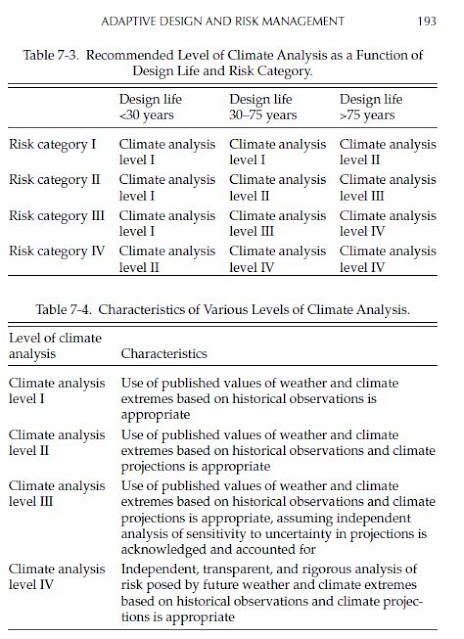
It is noted that the ASCE identifies levels of analysis in its Manual of Practice 140 entitled Climate-Resilient Infrastructure: Adaptive Design and Risk Management. In Chapter 7 Adaptive Design and Risk Management the manual provides recommended levels of climate analysis based design life and risk category. The following table excerpt shows the risk categories for buildings and other structure:


These table excerpts show the levels of analysis based on risk category and design life (top table), and the climate analysis characteristics.

So for buildings and structure with design life up to 75 years, where the risk category is low (Risk Category I, meaning low risk to human life), Level I climate analysis using "extremes based on historical observations is appropriate". For a longer design life beyond 75 years, the Risk Category I buildings and structures (low risk) should also include climate projections per climate analysis Level II. In my opinion, a deterministic future projection could be considered for such analysis based on a likely scenario (e.g., RCP 4.5).

Where there is a 'substantial risk to human life' or hazardous or toxic materials involved under Risk Category III, Level III analysis is recommended by ASCE for moderate design life (30-75 years). Such analysis would account for uncertainty as well, for example, and could consider confidence bands reflecting uncertainty on a future climate projection (e.g., bands surrounding RCP 4.5 projections).

For the highest Risk Category IV that applies to essential buildings and structures that are deemed 'essential facilities' and whose failure could pose 'a substantial hazard to the community', or that involve hazardous/toxic materials, more extensive climate analysis is required (i.e., Level IV). ASCE recommends "rigorous analysis of risk" for moderate design life and longer. Such an analysis could consider a range of scenarios, e.g., from RCP 2.6 to RCP 8.5, and the consequences of exposure to flood hazards. The likelihood of each scenario would have to be estimated to support rigorous risk-based analysis.

Are Six 100 Year Storms Across the GTA Rare Over a 14 Year Period When Considering Probabilities of Observing Extremes at over 150 Rain Gauges?

Roll a 100-sided die once. That is what looking
for a 100 Year storm at a single rain gauge
in a single year is like.
A motion at the City of Toronto notes the following regarding extreme rainfall in the GTA: "According to the Insurance Bureau of Canada, the Greater Toronto Area has had six “100 Year Storms” since 2005". See Mike Layton motion here: https://www.toronto.ca/legdocs/mmis/2019/mm/bgrd/backgroundfile-131063.pdf

CBC has reported on this: link

While we are all concerned about flooding, the question on large storm frequency is "So What?". Or more specifically, from a statistical, mathematical, logical point of view, is more than five 100 Year storms over a 14 year period (2005 to 2018) rare and unexpected, or does this have a high probability of occurring? As we know the Insurance Bureau of Canada does not always rely on proper statistics to support statements on extreme weather, confusing theoretical shifts in probabilities of extreme events with real data (see IBC Telling the Weather Story where IBC ignores Environment and Climate Change Canada's Engineering Climate Datasets).

Let's do some math to see if over five 100 Year storms is rare or not.

First, consider that a 100 Year storm has a probability of occurring of 1/100 = 1 percent per year.

***

Second, count up the number of rain gauges that have been proliferating across the GTA to support inflow in infiltration studies for wastewater studies and to support operational needs. Here are some counts with various sources:

i) City of Toronto (https://www.toronto.ca/city-government/data-research-maps/open-data/open-data-catalogue/water/#09dee024-b840-174f-7270-29c1a1773d14) - 46 rain gauges

ii) Region of York (https://www.york.ca/wps/wcm/connect/yorkpublic/b22ae2f3-5140-48f2-869e-a803d2552893/2017+Inflow+and+Infiltration+Reduction+Strategy+Annual+Report.pdf?MOD=AJPERES) - 71 rain gauges

iii) Peel Region (https://www.peelregion.ca/council/agendas/pdf/ipac-20110811/4b.pdf) - 6 rain gauges (correction July 25, 2019 - Peel has 28 rain gauges ... probabilities in this blog post will go up a bit)

iv) Halton Region (https://www.peelregion.ca/budget/2018/pdf/conservation-halton.pdf) - 14 rain gauges

v) Toronto and Region Conservation Authority (http://199.103.56.152/xcreports/Precipitation/precipitationOverview.aspx) - 14 rain gauges

Total number of gauges = 151. A good first estimate - certainly there are more. (correction July 25, 2019 - as Peel has 28 rain gauges the total is 173 stations)

***

Third, assuming each rain gauge observes rainfall events independently year to year, what is the chance of getting at least one 100 Year event at a single gauge in 14 years?

Probability = 1 - (1-1/100)^14 = 13.1% chance of a 100 Year storm storm at a single gauge. That seems pretty big.

The number of 'trials' or samples equivalent to 14 rolls of a 100-sided die, meaning 14 independent observations or 'samples' from the statistical population of events.

It is reasonable to assume that a single rain gauge can record a 100 Year event but not surrounding gauges? Yes indeed. The August 2018 storm in Toronto only exceeded 100 Year rainfall totals at one gauge. So it is reasonable for smaller, spatially isolated rainfall events that do occur.

***

Fourth, assuming all rain gauges observe rain independently what is the chance of getting more than one 100 Year events across all 151 gauge in 14 years?

The number of trials/samples/observations = 151  x 14 = 2114

Probability = 1 - (1-1/100)^(2114) = over 99.9% chance of at least one 100 year storm at 151 independent gauges. That is almost a certainty.

(Additional comment: we know that storms exceeding 100 Year volumes can cover large areas such that observations are adjacent gauges are not completely independent, especially if they are spatially very close - so this fourth scenario is considered an upper bound on sensitivity analysis considering gauge independence - below, another bound is evaluated assuming less independence).

What about more than five 100 Year storms over 14 years? We have to then consider combinations of events (we do not care which of the 2144 samples has the events) and approach this by subtracting the probability of 1, 2, 3, and 4 events. This summarizes the approach (thanks so much FP!):


The probability of 5 or more 100 Year events is again over 99.9% (see cell F22), showing that when there are many, many trials, the probability of a multiple rare event is very high.

***

Fifth, assuming large storms cluster across several gauges and they do not operate independently from each other for extreme events, and that say they observe 100 Year storms in groups of 5, what is the chance of getting one 100 Year event across 151/5 = 30.2 rain gauge clusters in 14 years?

The number of trials/samples/observations = (151 x 14) / 5 = 2114 / 5 = 422.8

Probability = 1 - (1-1/100)^(422.8) = over 98.5% chance of at least one 100 year storm at 30 independent gauge clusters.  Near certainty. Not rare at all!

Let's consider over five 100 Year storms again. A keen reader has shown that the probability is 41.6% for this, as shown in cell L22 in the spreadsheet image above. Again, pretty high chance of getting 5 or more events when gauges do not observe extremes independently, but rather in clusters.

For more on this analysis, and the probability of 5 or more occurrences in 423 observations the probabilities considered in deriving the probability are as follows:
  • 4 occurrences in 423 observations (P = 0.195038119)
  • 3 occurrences in 423 observations (P = 0.183893083)
  • 2 occurrences in 423 observations (P = 0.1297298)
  • 1 occurrences in 423 observations (P = 0.060868484)
  • 0 occurrences in 423 observations (P = 0.014245815)
  • Sum = 0.583775302
So P[ X ≥ 5; 423] = 1 - 0.583775302 = 0.416224698, or 41.6% noted above. This is the common approach for deriving the probability of a scenario, i.e., by subtracting the probability of the event not occurring from 1.0 (the probability of all events). In this case the sum of the probability of zero to 4 observations occurring is the probability of the scenario of interest (5 occurrences or more) not occurring. If you are interested in testing other scenarios and assumptions for size of rain gauge clusters, use this helpful web site (also used to check the calculations in the spreadsheet shared above): https://stattrek.com/online-calculator/binomial.aspx. Below are checks of the probability analysis:

Probability of 5 or more 100 Year Storms at Independent Rain Gauges (151 gauges x 14 years = 2114 'trials')
Probability of 5 or more 100 Year Storms at Clusters of Rain Gauges With Dependent  Observations (30.2 gauge clusters x 14 years = 422.8, say 423, 'trials')

There are more rain gauges in Durham Region and other Conservation Authorities in the GTA which means there may be more than 30 clusters to observe extreme weather in, meaning an even higher probability of observing extreme events.

So about 423 rolls of a 100-sided die may result in more than five occurrences of a single number with a relatively high probability. If the clusters are bigger, the probability is a bit less, but as we have seen, sometimes only one gauge 'sees' the 100 Year extreme rain. If gauges observe events in clusters of 10, which is an extreme end of the range as we have examples of storms affecting only one gauge (August 2018 in Toronto), there is still a probability for 5 events of over 5% (see below):

Probability of 5 or more 100 Year Storms at Large Clusters of Rain Gauges With Dependent  Observations (15.1 gauge clusters x 14 years = 211.4, say 211, 'trials')
Past flood events in Toronto reveal that between 1 and 12 rain gauges observe 100 Year rainfall depth, as shown in this Toronto Water presentation: https://www.slideshare.net/glennmcgillivray/iclr-friday-forum-reducing-flood-risk-in-toronto-february-2016
It shows:

  • May 12, 2000 - 1 rain gauge over 100 Year (see slide 9)
  • August 19, 2005 - 12 rain gauges over 100 Year (see slide 11)
  • July 8, 2013 - 6 rain gauges over 100 Year (see slide 19)
The August 7, 2018 flood in Toronto was due to only one Toronto rain gauge in the Open Data dataset exceeding 100 Year volumes. Therefore, assuming a cluster size of 5 dependent rain gauges within independent clusters that observe extreme events seems quite reasonable.


Conclusion - is it not rare to get more than five 100 Year rainfall observations at over 151 GTA gauges, over 14 years. The chances range from near certainty (over 99.9%) for independent events at each rain gauge to relatively high probability (over 40%) if gauges are independent clusters of 5 or more.

***

So what else does that tell us? There is a tendency to exercise an 'availability bias' in the words of Daniel Kahneman, and ignore statistics when making quick observations about extreme events. A description of this and other "Thinking Fast" heuristic biases surrounding flooding and extreme weather is in this paper.

Most media reports seldom "do math" and echo sources without question many times - that was the finding of the CBC Ombudsman on this topic of more frequent or severe extreme rainfall recently - see Ombudsman ruling.

Its one thing for a reporter to echo IBC statements on extreme weather for a news story, but Toronto should be careful in taking on a court case with limited data - it would be great to see any IBC statistics or analysis (unlike in the Telling the Weather Story communications). Toronto should also be aware that its flood problems are due mainly to its own design standards in the original size municipalities dating back before the 1980's. Spatial analysis shows that is where the risks are and where the flood reports are being made to the City of Toronto - see slide 36 in this review of flood risk factors which clearly do not include more extreme weather - partially separated systems have the highest risk and Toronto has allowed development to occur without mitigating risks in the past (hence the famous Scarborough Golf court case decision against municipalities for gaps in their stormwater management practices (Scarborough Golf Country Club Ltd v City of Scarborough et al)). Same thing on other GTA cities - see slide 7 in this presentation to the National Research Council's national workshop on urban flooding February 2018 for flood vulnerabilities in the City of Markham - see where Mississauga flood calls occur in this previous post (more than half of flood calls are in pre-1980 areas designed with limited resiliency for extreme weather).

So there has always been flooding:


And the most extreme rainfall intensities in Toronto over short durations happened in the 1960's:


And now extreme rainfall statistics from Environment and Climate Change Canada show decreasing short duration intensities since 1990 in and around Toronto:


.. as shown in a previous post. These 5 minute 100 Year intensities have dropped between 4.0 % and 8.1% between 1990 and 2016-2017 depending on the location.

Such decreases in short duration intensities are happening across southern Ontario as well, based on the newest Engineering Climate Datasets as shown here. Toronto should be careful in preparing for a legal challenge and any claims on flood causes.

As noted in my recent Financial Post OpEd, making a big deal about irrelevant risk facts distracts us from addressing the root cause of flood problems. The City of Toronto should try to not get distracted. And Councilor Mike Layton is probably in the running for a Milli Vanilli "Blame it on the Rain" award this year :)

***

Terence Corcoran covers this all very well in today's column, referencing analysis on this blog.

Note: probabilities for 5 or more events corrected/updated April 1, 2019. Thanks to keen readers for helping define the probabilities of combination events and for the nostalgic references to University of Toronto's Professor Emeritus Dr. Barry Adams' CIV340 course notes that outline the analysis approach.

***

What are the probabilities considering the updated number of stations (i.e., more in Peel), meaning a total of 173 stations? That is, 2422 trials if stations are independent and 484 trials if stations are clustered in clusters of 5.

For 5 or more 100-year storms in 14 years, the probability is 99.9% - 53.2% for independent and clustered gauges, respectively.

For 6 or more storms the probability is 99.9% - 35.6% for independent and clustered gauges, respectively.

Risks Are Where You Map Them - The Truth in WYSIATI (What You See Is All There Is) When Defining Urban Riverine Flood Plain Risks

"To Map or Not To Map, That Is The Question"

If buildings along a channel are subject to frequent flooding but there is no regulatory mapping, is it really a 'flood risk zone'?

Risks are sometimes equated to the presence of regulatory mapping that defines risk. But risks exist whether you map and manage them or not. This post explores the "Where?" and the "How?" of floodplain mapping to best define risks.

First some background - regulatory mapping, such as under Ontario's Conservation Authorities Act regulations, delineates risk areas where it has been decided to map risks. It is a choice - to map or not to map. Regulation and risk are therefore quite different, as risk can extend upstream of the last flood plain mapping sheet, extending further up the river system, or even up through the urban landscape and infrastructure systems. Obviously, our goal in terms of risk management and urban flood damage mitigation would be to map all the important risks - those contributing to frequent or extensive damages - and to then develop a strategy to address those risks.

While Ontario is quite advanced in terms of the identification and management of river flood risks, there are opportunities for improvement where risks on smaller urban watercourses are defined. Traditionally, a catchment size limit of half a square mile, or about 125 hectares, was used to define rivers reaches where hydrologic and hydraulic modelling would be completed to delineate the extent of the regulatory flood plain. Reaches for smaller reaches were not typically mapped. In new development areas, a smaller threshold is often applied during land use planning and development servicing studies which ensures that local risk are managed. However in historical development areas, it is not uncommon that some river reaches with catchment sizes of several hundred hectares are not mapped, meaning that risks in small flashy systems (those that respond to high intensity rainfall convective summer storms) are not identified, regulated, or mitigated.

Given today's focus on Best Practices to mitigate existing community flood risks, the mapping of riverine flood risks is a subject of attention. The federal government, Natural Resources Canada and Public Safety Canada, have recently published a Federal Floodplain Mapping Framework Version 1.0, 2017 that forms part of the Federal Floodplain Mapping Guidelines Series - a link to that document is here :

http://publications.gc.ca/collections/collection_2017/rncan-nrcan/M113-1-112-eng.pdf

The following figure summarizes the framework steps.

The report notes priority setting including "where to conduct floodplain mapping"  as a future activity:
We encourage that Priority Setting be robust to answer the "where" and "how far" mapping will be pursued. Why? There is a considerable amount of focus on next steps, getting lost in the weeds with LiDAR data acquisition and climate change assessments in the next delineation step in the framework. So the question is "Is there enough prioritization relative to other technical considerations?", as suggested in the follow graphic:


How about an example showing why "Where to Map?" is more important than "How to Map?".

The Don Mills Channel is a small urban drainage channel, with a historically realigned watercourse called Cummer Creek in the Don River Watershed. Floodplan mapping has been pursued since the 1960's in Ontario and a great summary of floodplain mapping history is available here: The State of Floodplain Mapping in Ontario Presented to the Institute for Catastrophic Loss Reduction, June 15, 2007, Don Pearson, General Manager, Conservation Ontario.

The City of Markham is conducting a flood reduction Class Environmental Assessment study to understand the causes of flooding in the Don Mills Channel study area and to develop a range of alternative solutions to reduce flooding and flood damages. The Class EA flood risk analysis modelling (not the regulatory mapping) shows the extent of flooding during a 100-year event:


While the watercourse is an area of focus for flood control, regulatory floodplain mapping was completed for the channel only in 2011. Prior to that, estimation mapping was completed (by this post's author) to support generic regulation updates in 2006.

So how has the characterization of risks changed with this 'new' mapping of the Don Mills Channel?The following figures illustrate how building flood risks in the newly mapped Don Mills Channel compare with city-wide Markham building flood risks identified as part of its Flood Emergency Response Plan.

Extending floodplain mapping a one tributary can dramatically change the characterization of overall riverine flood risk for the 100-year flood event. 

Riverine flood risks defined by depth of flooding at building structures changes significantly with the extension of floodplan mapping to previously unmapped watercourse reaches.
Frequent flooding during low return period events increases significantly with the extension of floodplan mapping to the Don Mills Channel, a tributary of the Don River also called Cummer Creek.

The charts above clearly show that the accounting of at-risk buildings within the extension of regulatory floodplain mapping in a single tributary dramatically changes the characterization of city-wide risks.  For example, the number of high flood depth structures (depth greater than 0.6 metres) during a 100 year event in the new reach is more than double the entire previous city-wide number. For frequent flood events like the 10 year storm in the last chart, the number of high-depth structures increases by 10 times or more - these new, frequent, high-depth structures can be expected to represent a high proportion of average annual flood damages.

While development occurred in the Don Mills Channel area in the 1960's (channelization and realignment was in fact to support development at the time according to the original 1966 design report), floodplain mapping was not initiated until 40 years later with the generic regulation update estimation mapping (i.e., HEC GeoRAS considering only overland components and not culvert enclosures - see this post for our perspective on riverine flood vulnerability methods). Advanced mapping to support regulation was completed later in 2011.

So what was the critical question to defining risk? Was it "How?" the floodplain should be mapped, like using various hydraulic models:

1) basic 1-dimensional HEC-RAS with no culverts (the 2006 HEC-GeoRAS estimation) or
2) more advanced 1-dimensional HEC-RAS with culverts (2011 mapping) or
3) even more advanced 2-dimensional PCSWMM integrated with the municipal storm pipe network (2018 Class EA)?

.. or using various design storms to determine design flows like:

1) TRCA's low-intensity watershed storm, or
2) Markham's high-intensity urban storm

... or considering various climate conditions like:

1) today's climate and IDF curves (which are not reflected in the watershed storms at all) or today's regulatory storm (Hurricane Hazel) or
2) tomorrow's estimated climate and IDF curves (take your pick on methods ... none of which converge) or tomorrow's regulatory storm (Hurricane Hazel ... exactly the same as today's Hurricane Hazel)

.. or refining the digital elevation model using LiDAR to get those flood depths to millimetre accuracy around every metre of he perimeter of each building, instead of typical mapping?

A recent presentation describes the modelling uncertainties in "How" various analysis methods have been applied from the 1960's to today:


Or is the most important question in defining risk the "Where?" Yes, "Where?" is the important part and the other considerations of "How?" are secondary or tertiary at best.

***

Nobel laureate Daniel Kahneman, author of Thinking Fast and Slow, referred to WYSIATI, an acronym for "What You See Is All There Is", which is a way of saying that we often miss things by acknowledging only the things we know (the known knowns) while being oblivious to the unknown unknowns. We recognize only what we see - or what we map and acknowledge. In the case of flood plain mapping, the risks we map are often considered to be all there is, since that is all that is being regulated or managed. Obviously then, "Where?" and "If" we map riverine flood risks can be of critical importance. And although our technical methods for delineating flood risks must be carefully considered, "How?" we define risks is relatively less important.
Are You Feeling (Un) Lucky?

Clint Eastwood inspired us all to consider risks in the Dirty Harry movies.  Everybody knows that in Russian roulette the odds of 1 in 6 are not in your favour when it comes to pulling the trigger.  Odds of 1 in 100 make some people complacent.  In general, people are at home with the really long odds of fatalities from serious events.  Some examples (see flooding highlighted):

SOURCES: http://www.nsc.org/lrs/statinfo/odds.htm - all records from 2002

1     Risk of Dying next year: Transport Accidents
Pedestrian 1 in 47,273
Pedal Cyclist 1 in 375,412
Motor Cycle Rider 1 in 89,562
Car occupant 1 in 17,625

2    Risk of Dying next year: Transport Accidents
Occupant  of pick-up truck or van 1 in 67,182
Traveling in heavy transport vehicle 1 in 631,450
Occupant  of a bus 1 in 6,696,307
Riding horse or animal drawn vehicle 1 in 244,180

3 Risk of Dying next year: Transport Accidents
While on railway train 1 in 10,283,615
Occupant of street car 1 in 71,985,305
Occupant of agricultural vehicle 1 in  1,932,491
While on water transportation 1 in 466,679
From air and space accidents 1 in 440,951

4 Risk of Dying next year: Falls
Tripping/slipping at same level 1 in 445,729
Falling from bed, chair or furniture 1 in 366,804
Falling from stairs or steps 1 in 180,188
Falling from ladder or scaffolding 1 in 709,215
Falling out of building 1 in 516,950

5    Risk of Dying next year: Struck by objects unintentionally
Hit by some object 1 in 333,265
Caught between 2 objects 1 in 2,503,837
Contact with machinery 1 in 441,628
Contact with sharp objects 1 in 2,742,297

6 Risk of Dying next year: Explosions
Unintentional firearms discharge 1 in 57,588,244
Explosion of pressurized vessels 1 in 10,664,490
Explosion of fireworks 1 in 57,588,244
Explosion of other materials 1 in 2,101,781

7 Risk of Dying next year: Animate causes
Struck by a person 1 in 11,074,662
Bitten by a dog 1 in 15,966,734
Bitten by other mammals 1 in 3,839,216
Bitten or stung by insect 1 in  22,149,325

8 Risk of Dying next year: Accidental drowning
All causes 1 in 83,534
In bath tub 1 in 818,015
In swimming pool 1 in 452,738
In natural water 1 in 217,314

9 Risk of Dying next year: Accidental threats to breathing
Suffocation in bed 1 in 565,700
Strangulation 1 in 969,499
Cave-in or falling earth 1 in 5,051,600
Food- in respiratory tract 1 in 351,577

10 Risk of Dying next year: Electricity, temperature
Electric transmission lines 1 in 2,641,663
Other electric current 1 in 894,227
Contact with hot tap water 1 in 7,198,531
Excessive  man-made heat or cold 1 in 28,784,122

11 Risk of Dying next year: Smoke, fire and flames
All causes 1 in 91,149
Uncontrolled fire in building 1 in 113,676
Controlled fire in building 1 in 8,226,892
Ignition of nightwear 1 in 22,149,325

12 Risk of Dying next year: Venomous Animals and plants
Contact with venomous snakes 1 in  95,980,407
Contact with venomous spiders 1 in 28,794,122
Contact  hornets, wasps and bees 1 in 5,332,245

13 Risk of Dying next year: Forces of Nature
All types and causes 1 in 236,211
From Lightning strikes 1 in 4,326,748
From earthquakes 1 in 9,288,426
From cataclysmic storm 1 in 4,570,498
From Floods 1 in 31,993,469
Excessive natural heat 1 in 822,689
Excessive natural cold 1 in 445,729

14 Risk of Dying next year: Poisoning and Noxious Substances
All types and causes 1 in 16,407
Gases and vapors 1 in 416,702
Alcohol 1 in 811,102
Pain relievers, anti-rheumatics etc 1 in 1,297,033
Narcotics and hallucinogens 1 in 34,843

15 Risk of dying next year: Intentional Self-Harm
All types and causes 1 in 9,096
Self -poisoning 1 in 52,487
Self-hanging, strangulation 1 in 44,559
Self-harm by firearm 1 in 16,831

16 Risk of dying next year: Assault by someone else
All types and cases 1 in 16,325
Assault by firearm 1 in 24,342
Assault by sharp object 1 in 138,834
Legal execution 1 in 4,297,630

17 Risk of dying next year: Cause known – undetermined intent
Poisoning 1 in 86,313
Hanging, strangulation 1 in 2,164,927
Firearm discharge 1 in 1,184,943
Falling from high place 1 in 2,795,546
Drowning or submersion 1 in 1,111,742

18 Risk of dying next year: Medical Conditions
Complications by medical and surgical care 1 in 101,281
Various medicaments and biologics 1 in 41,828
Anti-epileptic, sedative-hypnotic, etc 1 in 281,193
Overexertion, travel and privation 1 in 2,249,541

19 Likelihood of Mother Dying During Childbearing
In Developed Regions of World 1 death per 5000 live births
In Europe 1 death per 4167 live births
In Latin America and Caribbean 1 death per 526 live births
In Asia 1 death per 303 live births
In Africa 1 death per 120 live births

20 Lifetime Risk of Death in Childbearing
(includes risk per pregnancy and likely number of pregnancies.)
In North America 1 in 3750
In Europe 1 in 1895
Lain America & Caribbean 1 in 150
In Asia 1 in 105
In Africa 1 in 15

21 Unintentional Injury Deaths in Infants <1 year of age
Mechanical suffocation 1 in 18,970 live births
Motor vehicle (traffic) 1 in 22,075 live births
Fire and Flames 1 in 35,211 live births
Drowning 1 in 46,948 live births
Inhalation of non-food object 1 in 57,142 live births

22 Annual Risk of Death at Work
All workers 1 in 28,571
Agricultural workers 1 in 3,425
Mining 1 in 3,534
Professional & Business services 1 in 34,483
Financial activities 1 in 142,858

23 Annual Risk of Death at Home
All people, all risks 1 in 7,875
Death from Falls 1 in 23,162
Death from Poisoning 1 in 30,288
Death from Fires 1 in 87,500

24 Annual Risk of Death from Choking
Overall rate of Death 1 in 70,000
Risk for Teenager 13-20 years 1 in 1,000,000
Risk for Senior aged 53-63 years 1 in 100,000
Risk for Aged Person 75-84 years 1 in 10,000
Risk for Person 90-94 years 1 in 2,000

In general, we are all “at home with” many of the risks of likelihoods in the range 1 in 10,000 to 1 in 10 million.  When you examine the broad band of likelihoods for potentially fatal risks, it suggests that some high profile worries are of such low probabilities that logically society might do better to devote its resources to other more routine risks that are harming or even killing many more people in our society.

Similarly, events that have a high likelihood, and that are becoming more severe in term of damages should be revisited in terms of resources devoted to risk identification, risk prevention, risk remediation and in the case of flooding risks, emergency response.