Showing posts with label insurance. Show all posts

NRC National Guidelines on Flood Control Cost-Benefit Analysis Share Extensive Insurance Industry Loss Data Across Canada Define Flood Control Benefits

The National Research Council of Canada (NRC) has released the National Guidelines on Undertaking a Comprehensive Analysis of Benefits, Costs and Uncertainties of Storm Drainage and Flood Control Infrastructure in a Changing Climate.

The full guidelines are available here to download: https://nrc-publications.canada.ca/eng/view/object/?id=27058e87-e928-4151-8946-b9e08b44d8f7

These guidelines delve into many topics to support comprehensive benefit cost analysis. A previous post explored historical extreme rainfall trends related to flood damages (see post: https://www.cityfloodmap.com/2022/02/nrc-national-guidelines-on-flood.html). This post shares insurance industry loss data presented in the guidelines. Such data support the comprehensive assessment of direct and indirect flood losses that represent potential benefits of new and upgraded flood control infrastructure investments.

The NRC Guidelines identify two approaches for assessing flood damages for projects of various scale and detail including:

i) a bottom-up approach based on property-scale losses, and

ii) a top-down approach based on scalable national or regional insurance loss data.

Previously unavailable data was shared by several organizations including Munich Re, the Insurance Bureau of Canada, and CatIQ to support the analyses in the guidelines. Thank you!

CatIQ Property-Scale Flood Losses in Canada (Bottom-up Analysis)

Catastrophe Indices and Quantification Inc. (CatIQ) is a Toronto-based subsidiary of Zurich-based PERILS A.G. that delivers detailed analytical and meteorological information on Canadian natural and man-made catastrophes. Established in 2014, CatIQ and is supported by the majority of the Canadian insurance and reinsurance industry, allowing it to provide the most reliable source of catastrophe loss information in Canada. Data are available through CatIQ’s online subscription-based platform that includes comprehensive insured loss and exposure data used by the insurance industry and other stakeholders - we used this database to analyze regional and national flood and related water losses across Canada.

Records of flood and water loss and loss expenses analyzed were from January 2008 to January 2019 while records of sewer back-up/water losses analyzed were available from April 2013 to January 2019. 

As noted in the NRC Guidelines "Nationally, the average loss, representing closed claims is approximately $22,300 based on well over 70,000 claims – this average value is for 55 events. Due to many smaller events in the database, the median loss is lower than the average at $16,300". The following chart shows the distribution of losses across these 55 events (see Appendix D | Direct & Indirect Long Time Horizon Damages, Figure 8):
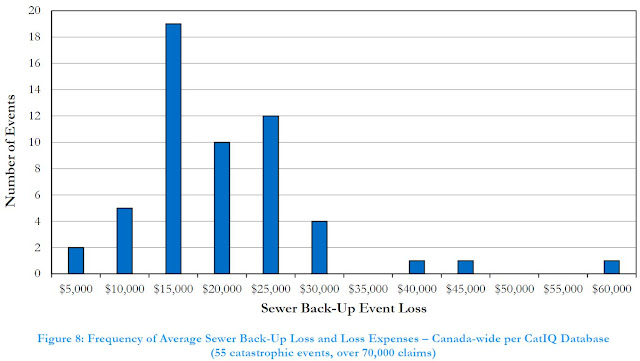
Given that CatIQ defines events and compiles loss data for those events with over $25M in losses, some small events with smaller losses. A review of CatIQ indicated that events with a higher number of claims, corresponding to more extreme and widespread events, reported higher average claims. 

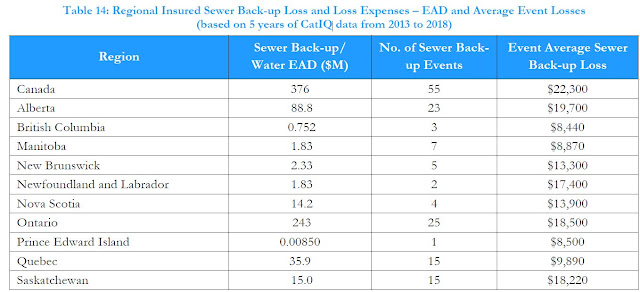
CatIQ data shows regional differences in sewer-back losses as reported in the NRC Guidelines (Appendix D | Direct & Indirect Long Time Horizon Damages, Table 14):
Intact Financial has recently noted that the often-cited average cost of $43,000 represents an upper limit for certain flood events (Intact Financial, 2019) - that makes sense for an extreme event, as reported in the NRC Guidelines:

"...an extreme event average claim approaching $40,000 could be appropriate. Specifically, the June 2013 Alberta flood event characterized by extensive riverine flooding had an average claim of over $37,000 for nearly 8000 sewer back-up/water claims."

The one instance of an event with average claims of up to $60,000 per policy represented only a handful of claims. Note that some have mistakenly cited the above $43,000 value as the average cost of a flooded basement across Canada, which is not supported by available data. It could be more reflective of overall losses in some regions, including both insured and uninsured losses. 

How can this data be used to assess benefits in cost benefit analysis? The NRC Guidelines presents a case study evaluating local sewer improvement alternatives using CatIQ data to assess benefits.  See Appendix I | Case Studies | Case Study 3 -  EXISTING STORM SEWER SYSTEM DAMAGE REDUCTION.

For another example, refer to the NRC Guidelines authors 2020 WEAO fall webinar paper that illustrates how regional sewer-back-up losses can be used to derive EAD values for project areas. That example applies where the number of flooded basements is available through detailed, local modelling. See post with paper:   https://www.cityfloodmap.com/2021/12/national-guideline-development-for.html.

More examples? Infrastructure Canada's Disaster Mitigation Adaptation Fund (DMAF) requires an assessment of Return on Investment (ROI) for candidate projects, specifying a minimum ratio of benefits to costs of 2:1. Local sewer back-up flood damages may be used to better define the potential benefits of infrastructure investments that reduce losses, following the approach in the WEAO fall webinar paper above. Depending on the level of service for a flood damage reduction project, a significant portion of expected damages many be avoided, and counted as benefits in a DMAF ROI calculation.

Munich Re Insured and Overall Losses (Top-Down Analysis)


Munich Re
gratefully drilled down into previously-available North American loss data presented in its NatCatSERVICE and provided historical Canadian insured losses for hydrological and meteorological events, and estimated uninsured losses.

The NRC Guidelines present the following figure showing these historical losses for meteorological and hydrological ‘event families’ including meteorological events (tropical storms, extra-tropical storms, convective storms and local windstorms) and hydrological events (flood and mass movement)  (see Appendix D | Direct & Indirect Long Time Horizon Damages, Figure 5): 
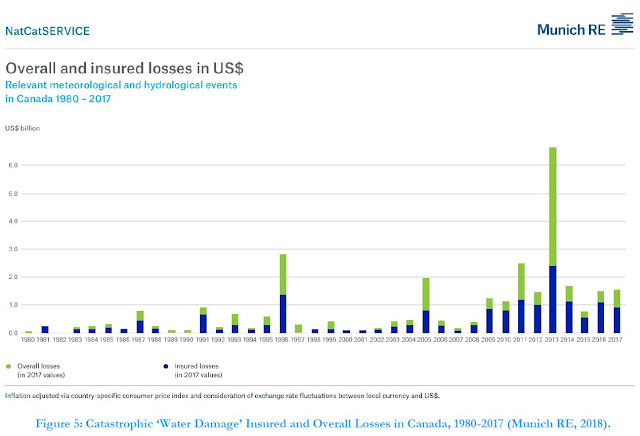
Munich Re data were then analyzed to derive return-period and Expected Annual Damages (EAD) across Canada. The analysis revealed 'average' 2-year losses of $426M and rare 100-year losses of $2.29B. The EAD was $697M for insured losses (the blue bars in the figure above), showing that expected losses that factor in occasional extreme losses is higher than the average.

Obviously such flood losses are significant and need to be managed. Expected annual insured losses of $695M represent about 0.4% of the Canadian GDP of $1.6T. 

Overall losses that include uninsured losses are higher and are represented by the green bars in the chart above. Munich Re estimates this as described in NatCatSERVICE documentation and considers insurance market penetration and reported disaster assistance payouts. The following chart shows the relation between overall and insured losses (ratio of green to blue bars above)(see (see Appendix D | Direct & Indirect Long Time Horizon Damages, Figure 7):
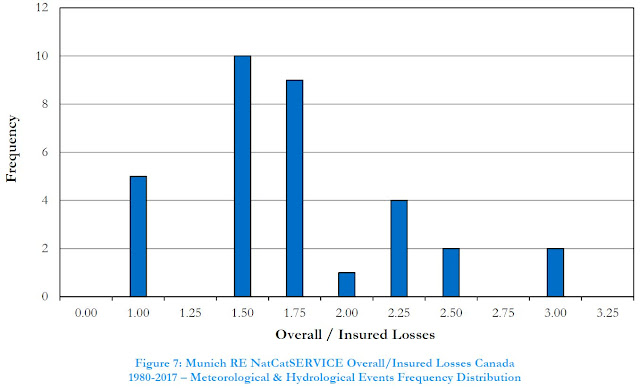

The overall losses in an individual year could be 3 times the insured losses. On average from 1983 to 2017, overall losses were 1.94 times insured losses. Why is there variability? Well, different types of hazards in Canada have different levels of insurance coverage. Sewer back-up has a relatively high degree of coverage and in years dominated by severe urban flooding events (e.g., Toronto and GTA in 2005) there would be relatively lower uninsured losses. In contrast, riverine flood insurance is was previously not available for residential properties in Canada until about 2015, and may not be available for high risk non-residential properties in floodplains - so in 2013, Calgary riverine flooding would not have been insurable (although many companies may still have granted claims in that instance as a 'goodwill measure' as noted by KPMG in 2014).  

How can Munich RE loss data be used to assess benefits of adaptation to flooding and inform funding policies? The overall losses can guide us as to how much we should invest to reduce these damages. 

The NRC Guidelines include case studies that apply Munich RE loss data including (see Appendix I | Case Studies):

i) CASE STUDY 1 – NATIONAL-LEVEL POLICY DEVELOPMENT, and

ii) CASE STUDY 2 – MUNICIPALITY-LEVEL PROJECT PLANNING

Case Study 1 conclusions note broadly how insurance loss information may be used: "This case study demonstrates that high-level policy decisions may be sufficiently informed through available information sources for future benefits (using insurance industry data to guide the estimation of avoided future losses), and the setting of target economic performance (using a benefit-cost ratio approach or some other relevant measure of return on investment) to establish, in this case, appropriate funding levels for allocation."

In the Case Study 1 example analysis, based on a i) Munich RE overall (insured and uninsured) EAD value of $1.347B (2017 dollars) for water damage (hydrological and meteorological events), and ii) CatIQ EAD of $819 million (2018 dollars) for insured flood loss and loss expense, a representative EAD of $1.0B was considered. This values was used to estimate an annual funding allocation noting:

 "Accordingly, based on the parameters assumed in this analysis relating to the estimation of benefits, time value of money and acceptable benefit-cost ratio (return on investment), a national flood protection policy could allocate about $2.8 billion annually (in 2020 dollars) for a 10-year period on projects that would achieve the technical performance objectives sought."

Case Study 2 conclusions note how insurance loss data was applied at a municipal and project-scale assessment of damages and benefits: "This case study demonstrates the downscaling of broad-scale insurance industry loss data to more granular levels for application to a municipality-level program and further down to the level of a collection of projects within the municipality. This “top down” approach to estimating future benefits (avoided losses) negates the need for highly detailed “bottom-up” methods for urban drainage system damage and benefit estimation when such approaches might be impractical or require excessive efforts relative to the accuracy they might produce. That is, estimation of urban drainage system damages on a bottom-up (property scale) basis, considering minor and major storm system risk, wastewater system risk, system interactions, and property-scale grading and construction factors has not been shown to be feasible or correlated to reported damages."

Munich RE loss data was used in Case Study 2, based on the City of Markham, Ontario to determine the following expected annual damages (and potential benefits of infrastructure investments):

• EAD for City-Wide Level Assessment: $13.2 million

• EAD for Assessment of Study Area: $5.1 million

• EAD for Assessment of Project Area: $0.8 million

The scaling of national Munich RE loss data and EAD considered proportion of population in Case Study 2. Regional loss data from IBC or CatIQ, excluding uninsured losses, could similarly be scaled. A review of proportion of GDP, as part of DMAF ROI assessments in Markham, indicated a similar proportion to population. The NRC Guidelines illustrate how several economic, demographic, built-form and infrastructure parameters are closely correlated across regions of Canada, and are related to regional expected losses. This is the basis of top-down loss scaling considered where bottom-up property scale analysis is impractical.

The following tables summarize the benefits (based on scaled Munich RE losses), costs (see a future post on costing data), and achieved benefit-cost ratios at a municipal, broad study area, and at a sub-project scale.



Financial Post Identifies Gaps in Insurance Industry Statements on Extreme Rain Causes, Flood Losses Trends, and Effective Mitigation Strategies

Terence Corcoran's article today covers a lot of the science and engineering that cityfloodmap.com has been exploring and promoting over the past few years. It is great to see many of our findings reflected in the mainstream media now. Wow!

Terence Corcoran is a National Post columnist and one of Canada's leading business writers and editors and he has been writing on the insurance industry, climate change and flooding for a couple decades. In his article today he explores the topics of:

1. Catasrophic loss trends, including flooding and the effects of GDP growth on trends as well as the influence of different data sets - we have explored that extensively in a previous post suggesting loss trends are not increasing as dramatically as the media suggests.

2. Green infrastructure implementation costs - we showed that those are prohibitive as in a previous post looking at Ontario-wide implementation city-by-city, and then again when looking at Ontario-wide lifecycle cost in another post.

3. Green infrastructure can make flooding worse - that is due to infiltration into already stressed wastewater systems as noted by the US Transportation Research Board, WEAO, and Ontario and US cities and local experts, as noted in a previous post.

4. Green infrastructure has questionable cost efficiencies as we see in a Metrolinx 'green' parking lot that is actually benefiting from a 'grey' traditional engineered stormwater detention tank- we have further shown that traditional grey engineered infrastructure has a better return on investment than green infrastructure as assessed in a detailed Class EA study and through a city-wide technology review benefit/cost analysis summarized in this post.

5. Green infrastructure and natural infrastructure does not reduce flood damages - contrary to what is promoted by the insurance industry like in the recent IBC report - it does not reduce flood damages according to the Ontario Society of Professional Engineers, and cannot cost-effectively reduce US river flood damages as described in this post.

6. Storms are not more frequent or intense due to climate change, and the insurance industry has made up "Insurance Fact" statements that has been rejected by insurance companies as reliable advertising - this was explored in a previous post and in our paper in the Journal of Water Management Modeling called "Evidence Based Policy Gaps in Water Resources: Thinking Fast and Slow on Floods and Flow"; https://www.chijournal.org/C449


Thank you Terence Corcoran for helping to shed light on these topics!

Economics of Flood Damage Claims - Large Events Dominate Overall Losses - Should Effective Mitigation Strategies Focus On "The Big Ones"

What type of meteorologic events dominate flood damage claims? Is it from many frequent small storms or a few infrequent black-swan events? Understanding what size of events cause the most losses can help us focus on the most effective flood loss mitigation measures - this is essential for achieving high returns on investment in flood mitigation strategies. By reducing flood losses in an economically efficient manner, high benefit-cost ratios can be achieved.

This post summarizes the distribution of FEMA's flood damage claims and explores what type of storm events - big or small - govern extreme weather losses.

FEMA summarizes the number of payout claims and the total value of payouts for significant flood events, i.e., those with 1500 or more payouts. The total value of payouts, adjusted for inflation to 2018 dollars, is plotted below against the total number of claims in the events between 1978 and 2017:

FEMA Average Claim Amount for Various Event Sizes (Number of Claims) - Small Significant Flood Events with a Minimum of 1500 Claims Per Event

The median number of payouts is 4115 with a median payout amount of $29,700, adjusted to 2018 dollars. This is over a total of 116 flood events from 1978 to 2017.

Larger storm result in more extensive flood damages and numbers of payout claims as shown on the following chart that labels some of the largest tropical storm / hurricane events:
FEMA Average Claim Amount for Various Event Sizes (Number of Claims) - Small and Large Significant Flood Events with a Minimum of 1500 Claims Per Event
How do the larger events affect the flood damage and payout values? The average flood claim payout of $36,200 is above the median value reflecting the skew in catastrophic event distribution - the right tail of rare black-swan events in the probability distribution of events pulls the average above the median.

Five of the 116 event have claim counts that are over ten to forty times the median number of claims. That is, Hurricane Ike and Irene had over 40,000 claims compared to the median count of just over 4000 claims. And Hurricane Harvey had over 160,000 claims. The losses are greater for these larger events with the best-fit line showing average claim values of over $50,000 to over $120,000 for these largest significant events. What effect do these claim counts have on weighted claim amount - they increase the claim-count-weighted average loss to $60,600 - more than double the median claim amount per event that is not weighted by the number of claims in each event.

So when looking at the economic losses associated with a significant flood event, we need to consider the size of the event. And when we develop strategies and best practices for flood resilient communities and flood risk mitigation, striving for significant damage reduction and return on investment in averted flood damage losses, we must also consider what events cause the most damages. Canada's Disaster Mitigation and Adaptation Fund (DMAF), for example, requires return on investment (ROI) evaluations for eligible risk reduction projects. It would appear that to achieve meaningful flood damage reduction ROI we must target solutions toward events leading to the most damages

Looking at FEMA's significant flood events, data show that 3 of 116 events account for 54% of the total inflation-adjusted damages. Those 3 events are Hurricane Harvey, Superstorm Sandy and Hurricane Katrina. And the top 20 events, each with total event claims of over $500M, account for 81% of the total claims. So it is clear that to reduce the bulk of flood damages we have to consider how to increase resiliency in existing communities during the largest storm events. If we target flood risk reduction for the small catastrophic events, the smaller 97 events, we will be addressing only 20% of the total claim value. So the 80/20 rule, the Pareto principle, does apply to flood damage reduction.

FEMA Inflation Adjusted Significant Flood Event Payout Distribution - Pareto Distribution and the 80/20 Rule


The impact on a few recent large events on damages helps show sample-bias in catastrophic event losses as explored in a previous post. That is, up to 2004 prior to Hurricane Katrina, the distribution of losses based on the 1978-2004 sample of events did not consider the true 'population' distribution of flood events that includes very extreme, right-tail events. As Fleming demonstrated in "Yep, We're Skewed", short samples with high skew underestimate losses of the true population of events.

***

For statistics geeks:

Could it be that the common chorus of explaining recent floods losses as being due to climate change may in fact be explained simply by statistics and larger sample sizes overcoming short sample biases (underestimation)?

Could it be that growth in high risk areas is driving flood damages higher? AON Benfield's review of Hurricane Harvey suggests that growth in at-risk areas explains some flood impacts:

 "Given the volume of water, local infrastructure across southeast Texas was simply unable to handle such an enormous amount of rainfall in a short amount of time. This led to major water run-off that quickly accumulated across a very large area. With so much residential and commercial growth throughout this part of the state – combined with abundant concrete and poor absorbing clay soil –this only worsened the flood impact."

Solutions to flood risk mitigation therefore cannot only be local infrastructure solutions to convey enormous amounts of water but rather land use planning policies to direct development and redevelopment away from high flood risk areas. As AON Benfield notes " Hurricane Harvey’s rainfall reached the 1,000-year rainfall return period based on many time intervals during the course of a number of hours and days.", and it is not cost effective, or technically feasible, to have local infrastructure convey the runoff from events of this magnitude.

***

Canada Connection (for those appreciate tree-sauce, skatey-punchy, and noble antler cows):

CatIQ claim datasets have been used to evaluate flood damages across Canada according to the size of the flood event (i.e., related to the number of claims). A similar pattern of increasing damages with increasing event size and distribution is apparent in the CatIQ datasets. In contrast to the FEMA claims noted above for many hurricane events, the CatIQ data reflect basement flooding claims primarily, as overland flooding has not been insured in the past and is not widely held. What is the magnitude of these Canadian claims? Aviva Canada provided this summary of claim trends and magnitude:

"In 2014, water damage claims accounted for 44% of dollars paid out on all Aviva Canada property damage claims, compared with 39% in 2004. The average cost per residential water damage claim has increased significantly – going from $11,709 in 2004 to $16,070 in 2014, a 37% increase."

So basement flooding damages are significantly less than FEMA's large scale catastrophe claims. CatIQ data shows that for larger events (those with higher claim counts) the average claim amount does increase above the Aviva Canada values noted above. Comprehensive benefit-cost analysis used to develop ROI rankings for flood mitigation projects would apply the lower range of typical damages to frequent to moderate events and the higher damages/claim amounts to the frequent events, factored by their probabilities. The most frequent storms, typically 5 to 10 year return period events as in a recent study by Atkins for the US EPA do not generate damages.


Toronto Overland Flood Visualization Using ArcScene - Hydrology and Hydraulics in Urban Areas Explain Reported Flood Risk

CityFloodMap.com overland flood risk analysis across the City of Toronto has been used in ESRI's ArcScene software to visualize at risk neigbourhoods and vulnerability zones where the correlation of urban overland / pluvial flooding and surcharged sanitary sewers resulting in basement flooding has been established. Flood risks exist beyond large regulated valley systems with a continuum of risk existing from river flood plain to individual building floor drain.


Additional visualization below includes identification of building structures within the estimated overland flood risk zone.


Land Use Change Drives Urban Flood Risk .. Yet Hydrologists Become "Useless Appendage" To More Virile Sciences

"The unsatisfactory state of hydrology is, in the final analysis, the result of the dichotomy between the theoretical recognition of hydrology as a science in its own right and the practical impossibility of studying it as a primary discipline but only as an appendage of hydraulic engineering, geography, geology, etc." Vit Klemeš in Dilettantism in hydrology: Transition or destiny?, Water Resources Research, Vol. 22, 1986.

That explains it! Nobody studies hydrology in its own right, and so this limp appendage of other scientific pursuits has been ignored. Pity - because hydrologic science and simple quantifiable land use changes can explain increased runoff and increased urban flood damages in Ontario municipalities. Why is it ignored? Because hydrology is just the run up to other things like dynamic hydraulic simulations and then infrastructure construction.

Take a look at these Ontario urban area land use maps, and see how the limits of urban areas have increased over thirty years or so from 1966 to the late 1990's. It can be dramatic. For some catchments, the increase in urban land coverage can be an order of magnitude.


Sure, some of these areas developed between 1966 and 2000 have stormwater management controls up to a point. But it is commonly accepted that the on-site local stormwater controls do not completely address cumulative volumetric runoff impacts at larger scales. And the controls are finite - not controlling the rarest storms that drainage infrastructure could see in its design life. So expanded urban areas can drive downstream flood risk. Yes, every catchment is different and maybe no property is at risk downstream of some urbanized area (i.e., dedicated drainage easements and wide regulated flood plains have maintained a wide major flow path) - but in may cities the overland flow path has not been mapped managed or preserved, so increased runoff and flood risk can result.
Tantric Hydrology
Brought to you by the Flood Guru.
OK, could a movie about hydrology be any worse than The Love Guru? I guess.....

Lost Rivers - Newtonbrook Tributary Flooded Basements - Former North York (Toronto)

From the late 1940's to late 1950's a tributary of the Don River in the Newtonbrook neighbourhood of North York was diverted and enclosed, fully replaced by residential development by the late 1960's. The transition in this area west of Yonge Street and south of Steeles Ave. W. is shown below (source Toronto archives, compiled by Toronto Water) :

Newtonbrook development 1947 - 1969, former North York, City of Toronto

Today, watercourse corridors are preserved through residential developments - larger valley corridors are protected through Ontario's Natural Hazards policies, acts and regulations to mitigate flood risks, and smaller tributaries are now protected to preserve local hydrologic functions (e.g., water balance) and environmental features (habitat).

The Newtonbrook tributary was not preserved although it conveyed runoff from over 250 hectares of land (2.5 square kilometers). The following images show the overland flow path through the area, including multiples of the estimated 100 year flow spread (1 time, 2 times and 4 times width), and basement flooding locations reported in May 2000 (orange), August 2005 (red), and July 2013 (yellow):

Overland flow path and 100 year flow spread (1 x, 2 x and 4 x) and historic basement flooding locations.

Today stormwater management practices would control the quantity of runoff from new development so that it matches pre-development peak flows during extreme rainfall events. This practice did not become widespread until the 1980's in Ontario. The Newtonbrook drainage catchment would have been controlled by about 5 or more stormwater ponds using today's standards (about one pond every 50 hectares).

Just over 35,000 Toronto properties are centered in the 100 year flow spread limits estimated through CityFloodMap.Com's overland flow and flood risk analysis. In many cases, like in the Newtonbrook area, these flow limits correspond to areas of high basement flooding risk given that the overland flow system can overwhelm the local sewer system with significant extraneous inflows during extreme storm events. City-wide analysis of overland flow risks and basement flooding correlation is presented in the following slides:


Lost River Walks Toronto - Yesterday's Rivers Are Tomorrow's Flooded Basements

"The objective of Lost River Walks is to encourage understanding of the city as a part of nature rather than apart from it, and to appreciate and cherish our heritage. Lost River Walks aims to create an appreciation of the city’s intimate connection to its water systems by tracing the courses of forgotten streams, by learning about our natural and built heritage and by sharing this information with others."
Source http://www.lostrivers.ca/

www.lostrivers.ca
Today's Lost Rivers are tomorrow's flooded basements.

According to Lost Rivers, Walmsley Brook was named for John Walmsley, a settler in the Leaside area or Toronto. It started as small streams near Duplex Avenue and Alexandra Boulevard which joined west of Yonge Street and flowed east to Mount Pleasant Road, then past Bayview and Eglinton, before heading south east to Laird Drive, the CPR rail line and the Don River.

Downstream reaches around McRae Drive to the outlet were largely open in 1922. The reach was subsequently filled in as shown on the images below.
Toronto Flooding
Walmsley Brook, tributary of the Don River was 'filled in' and piped near McRae Drive and Laird Drive and is a part of Lost River Walks, organized by Toronto Green Community.

The catchment draining to the low reach is over 400 hectares in area. That is significant as flood hazards were typically mapped when drainage areas reached 125 hectares, or approximately half a square mile. Today it is not uncommon to map river flood hazards for drainage areas as small as 50 hectares.

Given the large drainage area and the obstructions to flow along the overland flow path, it is no surprise that this are is subject to flood risks. But it does not manifest as river flooding - instead it is a combination of urban flooding overland, and basement flooding that is aggravated by extraneous inflows to the sanitary sewer system.

Over 250 flooded basements were reported after the May 12, 2000 storm in Toronto. The flooding was concentrated in the former Walmsley Brook watershed, and extended outside of it to the south west where the sanitary sewer system crossed into the watershed.
Toronto Overland Flood
The former Walmsey Brook alignment through Leaside is shown to the left. The same alignment is shown on the right along with reported basement flooding locations in the former watershed. Residential development west of Laird Drive and commercial development east of Laird Drive has reduced the overland flow capacity needed during extreme rainfall events.
Perspective of Walmsley Brook from outlet to Don River.
Detailed analysis using Ontario topographic data, geographic information system hydrology tools, and geo-referenced Toronto flood locations for May 12, 2000, August 19, 2095, and July 8, 2013 storms shows quantitatively that the overland flow path along lost rivers affects basement flood risk. A summary of the analysis is in a previous post.

The lesson? "You can take the river out of the neighbourhood, but you can't take the neighbourhood's runoff out of the residual flow path". Lost rivers not forgotten.

Lost River Walk Sunnybrook Plaza
Sag in the road - lost river near current Sunnybrook Plaza is along the original watercourse alignment. Eglinton Ave East, east of Bayview Ave, 1951. Source James Victor Salmon, Toronto Public Library:
http://www.torontopubliclibrary.ca/detail.jsp?Entt=RDMDC-PICTURES-R-3298&R=DC-PICTURES-R-3298 

Toronto flood lost rivers
Walmsley Brook in Leaside has been enclosed in sewers and the overland flow system has been filled in and blocked but the residual flow path remains in place. During extreme rainfall the storm sewer capacity will be exceeded and overland (urban) flooding will occur on the original brook flow path. Basement flooding is often concentrated along the flow path after impeded surface flow enters building flood drains and overwhelms the wastewater sewer system.
Bathurst Heights reach of Yellow Creek.
Map source Lost Rivers.
****

Lost Rivers describes many other lost watercourse features in Toronto. We will highlight a few of them in the weeks to come, but first here is another smaller system that demonstrated flood clusters during extreme storm events, although not as extreme as Walmsley Brook in Leaside..

According to Lost Rivers, Yellow Creek originates in the Downsview area and entered the Don River just north of The Prince Edward. The Bathurst Heights reach experienced flood clusters on May 12, 2000, and also on July 8, 2013. Note that our mapping for all July 8, 2013 flood reports is incomplete and does not show all the reported flood locations as the individual site data is not available from the city. However our May 12, 2000 mapping does reflect all reported locations and this likely reflects the broader July 8, 2013 incidents as well - as most properties are built at grades and with service connection very close to their neighbours, back-ups at one property general reflect risks and incidents at adjacent ones. Sometimes property owners do not report flooding to the city and instead work through their insurance company. In the most chronically flooded locations where no back-up insurance is available, there may be no reports.

The image below shows where Yellow Creek fits into the broader lost rivers network and shows details of flooding along the Bathurst Heights reach.

Perspective of Bathurst Heights reach of Yellow Creek, southwest of Bathurst and Lawrence, looking northward. This ArcExplorer oblique image shows exaggerated topographic relief, clearly shows the ups and downs of the former creek catchment. Historical flooding has been concentrated along the flow path upstream and downstream of Dell Park where runoff is concentrated during extreme rainfall events.
***
Link to More Toronto Lost Rivers

Trends in Canadian Short‐Duration Extreme Rainfall Data Contradict Insurance Bureau Statements

Rain intensity data in Canada show "lack of a detectable trend signal", despite recent statements by the Insurance Bureau of Canada ("Extreme weather events driven by climate change have increased in frequency and severity," said Don Forgeron, President and CEO, IBC, at a November 26, 2015 Economic Club of Canada event in Edmonton).

In this post we explain the rainfall intensity trend information available in Version 2.3 of Environment Canada's Engineering Climate Datasets, released in December 2014. That data is available here:

ftp://ftp.tor.ec.gc.ca/Pub/Engineering_Climate_Dataset/IDF/

(September 2, 2019 - the above ftp site is no longer - Version 3.00 IDF Files may be accessed here: http://climate.weather.gc.ca/prods_servs/engineering_e.html; the Version 2.30 trend file  "idf_v2-3_2014_12_21_trends.txt", is available here: https://drive.google.com/open?id=0B9bXiDM6h5ViQ0xnSDR2cUl3WXc)

The "What's New" document describe "A new set of graphs that represents the historical trends of IDF properties has been produced for each station".  These trend graphs have been featured in many posts on the www.cityfloodmap.com blog. Could it be scientists in Canada are muzzled from getting these facts out as that do not support climate change mitigation policies (cap and trade, Bill 172)? If storms are no worse, why look at emissions to address flooding?

The document Notes_on_EC_IDF.pdf available in Environment Canada's doc.zip package, entitled "Documentation on Environment Canada Rainfall Intensity-Duration-Frequency (IDF) Tables and Graphs Version V2.30 December, 2014", describes this new trend data in the appendix as follows:

Appendix: Trend Graphs

Trend graphs are included in release V2.30. The single station rainfall annual maximum series (AMS) were examined for any detectable trend, at a significant level 5%, for each of the durations examined. Figure A-3 is an example of such trend plots. The open circles in each plot represent the AMS rainfall amounts for the duration analyzed. These data are usually very scattered representing the variability of the climate. For most stations, the AMS does not feature any significant trends (Trend: N) but in some instances, an increasing (Trend: +) or decreasing (Trend: -) with time are noticeable. The slope with confidence levels are given in each duration plot.

The method and implications for trend analyses of IDF stations across Canada were reported in the paper: Mark W. Shephard, Eva Mekis, Robert J. Morris, Yang Feng, Xuebin Zhang, Karen Kilcup & Rick Fleetwood (2014): Trends in Canadian Short-Duration Extreme Rainfall: Including an Intensity-Duration-Frequency Perspective, Atmosphere-Ocean, DOI: 10.1080/07055900.2014.969677


So let's look at some trend indicators "+","-" and"N" for actual gauges.  The Toronto City gauge has decreasing rainfall intensity trends for all durations from 5 minutes to 24 hours.  The following mark-up shows that the 5 minute to 2 hour duration trends are flagged as "Trend :N", meaning not statistically significant. For longer durations, 6, 12 and 24 hours durations on the bottom three charts, the trends are flagged as "Trend :-", where the "-" means statistically significant. So some Toronto rainfall trends are decreasing to a large degree that is beyond the intrinsic variability expected in observed rainfall.
Climate Change Toronto
Toronto weather station 6158355 has decreasing extreme rainfall trends for all durations since 1940.
Over longer storm event durations, the decreasing storm intensity is statistically significant.
The noted Atmosphere-Ocean paper summarizes the Canadian extreme rainfall trend analysis in the abstract. Highlighted text below shows that there is no statistically significant trend overall in Canada, with the exception of parts of Newfoundland for durations of 1 - 2 hours:

Abstract
Short-duration (5 minutes to 24 hours) rainfall extremes are important for a number of purposes, including engineering infrastructure design, because they represent the different meteorological scales of extreme rainfall events. Both single location and regional analyses of the changes in short-duration extreme rainfall amounts across Canada, as observed by tipping bucket rain gauges from 1965 to 2005, are presented. The single station analysis shows a general lack of a detectable trend signal, at the 5% significance level, because of the large variability and the relatively short period of record of the extreme short-duration rainfall amounts. The single station 30-minute to 24-hour durations show that, on average, 4% of the total number of stations have statistically significant increasing amounts of rainfall, whereas 1.6% of the cases have significantly decreasing amounts.
However, regional spatial patterns are apparent in the single station trend results. Thus, for the same durations regional trends are presented by grouping the single station trend statistics across Canada. This regional trend analysis shows that at least two-thirds of the regions across Canada have increasing trends in extreme rainfall amounts, with up to 33% being significant (depending on location and duration). Both the southwest and the east (Newfoundland) coastal regions generally show significant increasing regional trends for 1- and 2-hour extreme rainfall durations. For the shortest durations of 5–15 minutes, the general overall regional trends in the extreme amounts are more variable, with increasing and decreasing trends occurring with similar frequency; however, there is no evidence of statistically significant decreasing regional trends in extreme rainfall amounts. The decreasing regional trends for the 5- to 15-minute duration amounts tend to be located in the St. Lawrence region of southern Quebec and in the Atlantic provinces. Additional analysis using criteria specified for traditional water management practice (e.g., Intensity-Duration-Frequency (IDF)) shows that fewer than 5.6% and 3.4% of the stations have significant increasing and decreasing trends, respectively, in extreme annual maximum single location observation amounts. This indicates that at most locations across Canada the traditional single station IDF assumption that historical extreme rainfall observations are stationary (in terms of the mean) over the period of record for an individual station is not violated. However, the trend information is still useful complementary information that can be considered for water management purposes, especially in terms of regional analysis.

The following chart by CityFloodMap.Com aggregates all the trend indicators in the version 2.3 dataset, counting combinations of trend slope and statistical significance as follows:

  • "Trend :-",    slope negative : Significant Decrease
  • "Trend :N",  slope negative : Decrease
  • "-99.9" :                                 No Data
  • "Trend :N",   slope positive : Increase
  • "Trend :+",   slope positive : Significant Increase
Climate Change Canada
Across Canada, only a few percentage of weather stations have significant increases in recorded extreme rainfall, for any given duration of storm. IDF curves based on these overall stable trends would not change over time.

The Toronto City ("Bloor Street gauge") rainfall trends would fall into the light green "Decrease" range for 5 minutes, 10 minutes, 15 minutes, 30 minutes, 1 hour and 2 hours, and fall into the dark green "Significant Decrease" range for the 6 hour, 12 hour and 24 hour durations.

It is interesting to review the Pearson Airport gauge data trends given the record setting rainfall on July 8, 2013 that caused widespread urban flooding in Toronto. Even with the significant 2013 rainfall event, the 5 minute, 6 hour, 12 hour and 24 hour trends are negative, but not statistically significant, as indicated by the "Trend :N" flag. The 10 minute to 2 hour duration trends are positive but not statistically significant.

The confidence limits show that while there may be upward trends in the 15 minute extreme rainfall amounts - the slope is +0.02 mm/year - there is also a chance that the trend is downward by a significant amount (lower confidence band is  -0.12 mm/yr). This help illustrate why the positive trend is not statistically significant, as rainfall patterns are highly variable and minor trends can occur due to the random nature of observations.

 Many factors affect flood risks and damages, and those related to runoff have increased over decades in many Canadian cities.  For example the Don River Watershed has increased in the amount of impervious, high-runoff cover from 15% in the 1950's to nearly 90% today and many overland flow paths, critical for conveying overland flow during extreme events, have been blocked or constrained. 

In general, the Insurance Bureau of Canada has not relied upon data to make weather statements and has instead relied on theoretical statements, confusing projections with observations, and substituting temperature probability density functions with severe rainfall distributions:


"Without knowledge action is useless and knowledge without action is futile."
Abu Bakr

Let's hope that IBC can improve knowledge of Environment Canada's Engineering Climate Datasets including the new trend analysis available - this is needed to better inform inaccurate statements on extreme rainfall trends and to focus instead on important flood risk factors. Cap and trade climate mitigation won't help reduce flooding because storms are not getting worse - so the government should focus on infrastructure upgrades in areas built before the 1980's (most cities), i.e., areas with lower levels of service in drainage design.

***

Here is a list of Ontario weather stations where the measured annual maximum 15 minute storm duration intensities are decreasing:     

Station ID Name
    6020LPQ ATIKOKAN (AUT)                                        
    6037775 SIOUX LOOKOUT A                                       
    6041221 CARIBOU ISLAND                                        
    6046770 PUKASKWA NATL PARK                                    
    6056907 RAYNER                                                
    6059408 WAWA (AUT)                                            
    6068158 SUDBURY SCIENCE NORTH                                 
    6073980 KAPUSKASING CDA ON                                    
    6079068 UPPER NOTCH                                           
    6084307 LAKE TRAVERSE                                         
    6085700 NORTH BAY A                                           
    6100971 BROCKVILLE PCC                                        
    6101901 CORNWALL ONT HYDRO                                    
    6104027 KEMPTVILLE CS                                         
    6104146 KINGSTON A                                            
    6104175 KINGSTON PUMPING STATION                              
    6105978 OTTAWA CDA RCS                                        
    6106000 OTTAWA MACDONALD-CARTIER INT'L  A (significant trend)              
    6107836 SMITHS FALLS TS                                       
    6110557 BARRIE WPCC                                           
    6111792 COLLINGWOOD                                           
    6112072 DORSET MOE                                            
    6116132 OWEN SOUND MOE                                        
    6116843 RAGGED RAPIDS                                         
    611E001 EGBERT CS                                             
    6127514 SARNIA AIRPORT                                        
    6133362 HARROW CDA AUTO                                       
    6135638 NIAGARA FALLS                                         
    6136606 PORT COLBORNE                                         
    6137287 ST CATHARINES A                                       
    6137362 ST THOMAS WPCP                                        
    6137730 SIMCOE                                                
    6139525 WINDSOR A                                             
    6140818 BLUE SPRINGS CREEK                                    
    6140954 BRANTFORD MOE                                         
    6149625 WOODSTOCK                                             
    6142286 ELORA RCS                                             
    6151042 BURKETON MCLAUGHLIN                                   
    6153194 HAMILTON A                                            
    6154820 MAIN DUCK ISLAND                                      
    6155722 OAK RIDGES                                            
    6155790 ORANGEVILLE MOE                                       
    6158355 TORONTO CITY                                          
    6158406 TORONTO BOOTH                                         
    6158665 TORONTO ISLAND A  (significant trend .. so is 5 minute and 10 minute storm duration)    
Climate Change Ontario                                    
    6158732 TORONTO LESLIE EGLINTON                               
    61587PG TORONTO SENECA HILL                                   
    6158875 TRENTON A                                             
    6166418 PETERBOROUGH A                                        
    6166450 PETERBOROUGH STP                                      
    6169453 WEST GUILFORD  


Extreme rainfall trends in Canada (Environment Canada Engineering Climate Datasets) are documented in the following posts:

Static Maps: http://www.cityfloodmap.com/2015/12/severe-storm-trends-canada-rainfall.html

Interactive Map: http://www.cityfloodmap.com/2015/12/canadian-extreme-rainfall-map-climate.html

Table Summaries: http://www.cityfloodmap.com/2015/12/canadian-extreme-rainfall-summary-by.html

Chart and Table: http://www.cityfloodmap.com/2015/12/top-weather-story-in-canada-2015-less.html

Long-term Station Table: http://www.cityfloodmap.com/2015/12/long-term-climate-change-short-term.html

Environment Canada Denies Changes: http://www.cityfloodmap.com/2015/10/bogus-statements-on-storms-in-cbcnewsca.html

Contradicting Insurance Industry Claims: http://www.cityfloodmap.com/2015/12/trends-in-canadian-shortduration.html

Canada Climate Change