Showing posts with label IDF. Show all posts

Southern Ontario Extreme Rainfall Intensity Trends - Update From Environment Canada Engineering Climate Datasets

Environment and Climate Change Canada has updated and extended the Engineering Climate Datasets as noted in the last post. This post shows the updated trends in extreme rainfall intensities across long-term southern Ontario climate stations - the good news is that intensities have not increased. This means that infrastructure built in the last few decades is not undersized considering current rainfall design intensities.

Previously trends in some southern Ontario intensity-duration-frequency (IDF) values and annual maximum series were evaluated in my paper "Evidence Based Policy Gaps in Water Resources: Thinking Fast and Slow on Floods and Flow" in the Journal of Water Management Modelinghttps://www.chijournal.org/C449

Further analysis of trends in long-term stations has been presented in this blog and in the National Research Council of Canada's "National Guidelines on Undertaking a Comprehensive Analysis of Benefits, Costs and Uncertainties of Storm Drainage and Flood Control Infrastructure in a Changing Climate" - that guideline included trends in southern Ontario up to Version 3.10, as presented in the earlier post: https://www.cityfloodmap.com/2022/02/nrc-national-guidelines-on-flood.html

The southern Ontario IDF trend data has now been updated based on the Version 3.3 dataset released in May 2023 and includes some station updates to 2021- 9 of the 21 stations were updated. The following table and charts show the trends in 2-year to 100-year design rainfall intensities.

The table below shows changes in average intensity - decreases since 1990 are shaded in green and increases are in red. Note the the trends are weighted by record length. Across all durations and return periods the average decrease is - 0.33 %.  That is a slight decrease from the Version 3.20 datasets, meaning less intense rainfall when more recent data has been included. On average 30 statistics decreased while 20 statistics increased.


It is noteworthy that none of the 2-year intensities increased and the largest increase was 0.8% for 100-year intensities at one station for durations of 30 minutes and 1 hour. Overall for 21 stations 100-year intensities were virtually unchanged with the average intensities decreasing 0.1% after 30+ years, and the median increasing 0.2%. Skewed data statistics should increase over time with longer records - check out this post for more on that: https://www.cityfloodmap.com/2016/02/ontario-climate-change-trends-going.html


The following chart shows the range of changes for each return period as well as the average change. The decreases are greater than any increases for the 5 to 100-year events.


(note: above chart average intensity change dashed line corrected Nov. 10, 2024)

The following chart provides more of a breakdown by duration. One can see the red 5 minute intensities decreased on average for all return periods. The 2 hour to 24 hour intensities decreased for most return periods and where there were increase they were minor compared to other decreases. For the 5-year to 100-year return periods the 15 minutes to 1 hour intensities increased, but by no greater than 0.8%. These increases and decreases are basically insignificant in terms of impacts on infrastructure design.


This last table is annotated to show how various statistics are used in design. Infrastructure that has been designed considering short duration intensities like local sewer systems are now subject to virtually the same 2 to 10-year design intensities that existed over 30 years ago. Ponds designed for long duration higher return periods (e.g., 100-year events) are now subject to virtually the same intensities, or design event volumes, they were subject to decades ago as well. 


Environment Canada IDF Curve Update - Version 3.30 Release Adds Stations and Extends Data Records

Environment and Climate Change Canada has released the Version 3.30 of the Engineering Climate Datasets: https://collaboration.cmc.ec.gc.ca/cmc/climate/Engineer_Climate/IDF/

The number of stations and the length of average station record has increased with 276 updated stations, 38 new stations and 9 joined stations. This brings the total number of stations to 714, a significant increase relative to the time I started working.

The following table and charts illustrate how the number of stations and station-years of record have increased over time.

The number of "station-years" of data in the current data set (some data up to 2021) is 66% greater than the approximate number of station years in earlier data up to 1990. That is good to see.

Average record length is now up to 26.2 years, and the average 'last year' of data is just past 2007 (there are 3 stations that stopped in the 1940's, which brings the average last year down).


This chart shows how the number of stations and station-years of data have increased over the past several decades. Note that the years on the x-axis for 3.1, 3.2, and 3.3 are the respective release years (2019, 2021 and 2023), and not the newest data year included.


There have been suggestions that the number of stations has declined, adversely affecting the ability to assess changes in extreme rainfall intensities - see discussion in an earlier post https://www.cityfloodmap.com/2020/06/do-we-have-enough-climate-stations-in.html

Mekis et. al noted that the number "Manual" stations has declined as shown in the following chart - that can reflect the change in technology to automated stations that replaced manual stations (remember those analog strip charts?). The number of stations with IDF data has increased though, from only 532 stations in the 1990 data set to 714 now - a 34% increase. Those increases in station numbers are shown against the decrease in manual stations below. 


The average record length has been increasing overall as well (see table above), resulting in more reliable trend data today. Note that the addition of many new stations tends to pull the average record length down as shorter record length stations are factored in. Overall, more data is better and the new station records can extend over time.

NRC National Guidelines on Flood Control Cost-Benefit Analysis Indicate 100-Year Storm Intensities Not Increasing

The National Research Council of Canada (NRC) has released the National Guidelines on Undertaking a Comprehensive Analysis of Benefits, Costs and Uncertainties of Storm Drainage and Flood Control Infrastructure in a Changing Climate.

The full guidelines are available here to download: https://nrc-publications.canada.ca/eng/view/object/?id=27058e87-e928-4151-8946-b9e08b44d8f7

These guidelines delve into many topics to support comprehensive benefit cost analysis. As the effects of a changing climate on flood damages (and adaptation benefits of reducing them) are considered, trends in extreme rainfall across Canada are reviewed in the foundation research. The review shows that on average extreme rainfall intensities have not increased when the most recently observed data is considered.

Extreme rainfall intensities can be characterized by the high return period values in Intensity-Duration-Frequency (IDF) statistics. For example the 100-year rainfall intensity would be the rate of rainfall over a range of durations that has a 1% chance (i.e., 1/100) of occurring in a single year, based on the statistical analysis of past observations.   Similarly 50-year storm rainfall rates have a 2% change of occurring during any year (i.e., 1/50), 25-year rainfall has a 4% chance, 10-year has a 10% chance, etc..

The guidelines present the following table showing 2-year to 100-year design rainfall intensity trends at 226 climate stations across Canada for durations of 5 minutes to 24 hours (Appendix E, Table 17):


As shown, 100-year storm intensities have decreased on average by 0.5% from the v2.00 to the v3.10 Engineering Climate Datasets. On average the derived 10-year to 50-year rainfall rates have decreased as well.

IDF intensity values are derived from observed annual maximum rainfall values, called an annual maximum series (AMS). One can look at the trends in AMS values to understand how derived 'return period' intensities are changing over time. The NRC guidelines summarized Environment and Climate Change Canada's analysis of these trends across Canada in the following table (Appendix E, Table 11):


The table counts instances where observed rainfall has decreased significantly (i.e., a statistically strong trend), has decreased (a weaker trend), has not changed, has increased (a weak trend), or has increased significantly (a strong trend).  Across Canada the totals show decreasing trends in 131+2235=2366 data points and increasing trends in 2526+251=2777 data points. And 266 data points showed no change. This summary indicates that both decreases and increases are occurring, with slightly more increases.

The NRC guidelines present additional analysis of more regional trends as well. This can help practitioners understand recent changes in extreme rainfall affecting local flood damages. For example the AMS trends in southern and northern Ontario are presented in the following two tables (Appendix E, Annex E1, Table A Part 3 & Part 4):

Ontario is shown to have increasing and decreasing AMS values (i.e., annual maximum observed rainfall) that varies by location (climate station) and duration. In some cases annual maximum rainfall is decreasing/unchanged or increasing/unchanged for all durations while in others short duration values have increased while long duration values have decreased - or vise versa. For example:  

Stations with all decreasing/unchanged trends for all durations:

  • Elora RCS
  • Hamilton A
  • Toronto City
Stations with all increasing/unchanged trends for all durations:
  • Toronto North York
  • Sioux Lookouk
  • Geralton A
  • Thunderbay CS
  • Belleville
Overall there are more decreasing AMS trends in southern Ontario (top table) than in northern Ontario. (Note the divide for southern and northern climate stations was taken as latitude of 44 degrees so Brockville, Kingston, Kemptville and Ottawa stations are in the northern group.)

The changes in IDF design intensity values for southern Ontario follow the regional trends in AMS values. This is what is expected since IDF statistics are derived from the observed AMS data. While Table 17 above showed changes in IDF values between the v2.00 and 3.10 datasets, essentially the difference resulting from accounting for the last 10 years of observations, southern Ontario IDF changes over a longer period were assessed in the NRC guidelines. The following figure shows the range in design intensities at long term stations since 1990 (Appendix E, Figure 2): 


Overall 2-year rainfall intensities, representing smaller storm severity, have decreased. Meanhile 100-year intensities have increased and decreased. This analysis aggregates all durations. Given the variability from station to station shown earlier (e.g., Toronto City has decreasing trends while Toronto North York has increasing trends, trends in long and short durations are inconsistent at individual stations), there is a benefit in aggregating larger sets of data (across durations and geography) to estimate overall regional trends.

(Aside - the analysis of southern Ontario IDF trends in the NRC guideline presented above were recently updated to reflect the v3.20 datasets and average trends for durations within each return period were analyzed as well. Results are presented in this post: https://www.cityfloodmap.com/2021/10/rainfall-design-intensities-in-southern.html


The figure above shows more consistent decreases across durations for the small storm intensities (i.e., 2 to 5-year return periods.)


Has Extreme Rainfall Become More Severe in Canada? - Research Shows Rain Intensities Mostly Unchanged (Stationary)

A research paper Assessment of non-stationary IDF curves under a changing climate: Case study of different climatic zones in Canada in the August 2021 Journal of Hydrology: Regional Studies by Silva et al. evaluated trends in historical annual maximum rainfall across Canada for a range of durations at climate stations with long-term records (over 50 years) (link: https://www.sciencedirect.com/science/article/pii/S2214581821000999). Projected future IDF curves are discussed in a future post.
Regarding observed rainfall maxima, the paper comments on the lack of consistent trends observed:
"There is no clear spatial pattern of trend in precipitation among the considered regions of Canada. Only the Moncton station shows a significant non-stationary behaviour in GEV modelling over most of the durations. No change pattern (i.e., trend detection) is confirmed for all durations at two sites under the influence of Great Lakes (London and Hamilton)."
The following Table 2 excerpt from the paper shows where annual maximum precipitation is stationary (not changing, as noted with the symbol "I") and non-stationary (changing) over the observation period.

Table 2. The best GEV model for each station and different durations in the historical period*.

Duration (minutes)Selected Station
CalgaryHamiltonLondonMonctonVancouverWinnipeg
5IIIIII
10VI (0.030)IIIIII
15IIIVI (0.043)II
30IIIV (0.030)II
60IIIII (0.003)II
120IIIVII (0.047)II
360IIIII (0.041)VII (0.011)I
720II (0.036)IIII (0.016)II
1440IIIII (0.002)IVII (0.025)

The best GEV model is shown using I to IX, according to the list of models in Appendix A. I corresponds to the stationary model, while values from II to IX correspond to the non-stationary models.

In central Canada, 26 of 27 rainfall series of maximum rainfall over durations of 5 minutes to 24 hours for Hamilton, London and Winnipeg stations were stationary, i.e., unchanged. The Great Lakes region represented by London and Hamilton, where no change in annual extreme rainfall was observed, also includes several large urban centres. 
A previous post evaluated Environment and Climate Change Canada annual maximum rainfall trends for 676 climate stations across Canada: https://www.cityfloodmap.com/2021/10/annual-maximum-rainfall-trends-in.html
There were few statistically significant trends, up or down, in the most recent v3.20 datasets, as noted in the following chart:

This summary table below shows that earlier datasets had similar trends with the majority of trends (i.e., over 90% of stations with calculations available showed no significant trend):

Trend in Maximum Rain    v3.20       v3.10       v3.00         v2.30
Significant Increase              4.16%     4.28%       4.18%        4.09%
Significant Decrease             2.25%     2.24%       2.33%        2.30%
No Significant Trend          85.73%    85.80%     85.55%      86.37%
No Calculation                      7.86%      7.68%       7.94%        7.24%

Looking at particular regions such as Southern Ontario and Manitoba where stationary annual maximum rainfall was observed in the paper above, one can see the variability in trends and significant across different stations and durations.

Southern Ontario, including the Hamilton and London stations has more decreasing trends than increasing ones:


In Manitoba, the trends vary by station with some recording increases over all durations with other recording decreases. Winnipeg has a combination of decreases, no change, and an increase for the 9 durations evaluated as shown below:


These trends are as reported in Environment Canada's v3.10 Engineering Climate datasets and will be published for all regions in the upcoming National Research Council of Canada cost benefit guideline for flood control infrastructure in a changing climate.

The tables above suggest that evaluating single stations may not provide a complete picture of overall changes in a region. For example, the paper highlights the non-stationarity in Moncton annual maximum rainfall. Other long term stations in New Brunswick, such as Fredericton have some trends that are opposite to those observed in Moncton (i.e., the Fredericton station has more decreasing trends than increasing ones and a statistically significant decrease), and others do not exhibit as strong increasing trends (e.g., the Charlo Auto station does not have the same number of statistically significant increases as Moncton and its 1-hour rainfall has not increased). Therefore Moncton is not representative of other long-term New Brunswick station trends.


The following charts show the v3.20 annual maximum series trends for the six stations studied in the paper, i.e., Calgary, Hamilton, London, Moncton, Vancouver and Winnipeg.


Only Moncton 6, 12 and 24-hour series have statistically significant increases. As noted above, Fredericton has observed decreasing trends as well, including a statistically significant decrease in 5-minute annual maximum rainfall, and no statistically significant increases:


Ultimately, annual maximum rainfall series are used to derive design rainfall intensities (IDF curves) by fitting a probability distribution to observed annual maxima. A previous post demonstrated how IDF values changed following the addition of recent observations (link:  https://www.cityfloodmap.com/2020/07/how-have-rainfall-intensities-changed.html):


On average, extreme intensities (red dots represent 100-year intensities) have decreased slightly for all durations. Less extreme intensities (green dots represent 2-year intensities) have increased slightly. Regions have different trends, sometimes with short duration intensities increasing and long-duration intensities decreasing, and vise versa as shown in another post: https://www.cityfloodmap.com/2020/07/can-we-use-daily-rainfall-models-to.html

***

The paper also presents future rainfall intensity projections that will be reviewed in an upcoming post. A review of projected results, included in supplemental material but not the main document shows that under some emissions scenarios (i.e., representative concentration pathways), rainfall intensities are projected to decrease in Ontario. The main document only presents projections for a high emissions scenario (RCP8.5) that has been questioned in terms of its likelihood by the Pacific Climate Impacts Consortium (see Science Brief: https://www.pacificclimate.org/sites/default/files/publications/Science_Brief_39-June_2021-final.pdf)


The Science Brief notes "Given that RCP8.5 is not the most "likely" outcome of emissions following business-as-usual or stated policy intensions, its reasonable to refer to it as a high emissions scenario instead of business-as-usual.

Others have also questioned the validity of RCP8.5 as Roger Pielke Jr. reported in Forbes (https://www.forbes.com/sites/rogerpielke/2019/09/26/its-time-to-get-real-about-the-extreme-scenario-used-to-generate-climate-porn/?sh=23797f704af0) and with Justin Ritchie in Issues in Science and Technology (https://issues.org/climate-change-scenarios-lost-touch-reality-pielke-ritchie/).

Why is understanding emissions scenario relevant to rainfall design intensities? Because temperature-based adjustments are recommended to project future rainfall design intensities (see Climatedata.ca and CSA IDF Guide approach in an upcoming post), and temperature changes depend on the emissions scenario considered. High emissions scenarios can be considered in future projections "if rainfall consequences to infrastructure are severe" as part of risk-based decisions making, according to Climatedata.ca. The ASCE's MOP 140 Climate-Resilient Infrastructure: Adaptive Design and Risk Management, in particular Chapter 7 Adaptive Design and Risk Management, also provides recommended levels of climate analysis as a function of design life and risk category, and the characteristics of various levels of climate analysis.

Annual Maximum Rainfall Trends in Canada - Environment and Climate Change Canada's Updated V3.20 Datasets Show Few Significant Trends

Previous posts have presented overall trends in annual maximum observed rainfall amounts at Canadian climate stations (link: https://www.cityfloodmap.com/2020/12/design-rainfall-trends-in-canada.html).

Environment and Climate Change Canada (ECCC) periodically updates trend analysis on the annual maximum series (AMS) for each station, and these series are used to derive design intensities, i.e., Intensity-Duration-Frequency curves. Data area available here (link):  https://climate.weather.gc.ca/prods_servs/engineering_e.html

In May 2021 additional analysis has been included in these Engineering Climate Datasets. The "Whats_New_EC_IDF_v3-20.pdf" file includes a summary table that provides counts of stations and additional station years added with recent update:

The v-3.20 update adds 490 station-years of data. There are currently 17,133 station-years of data. The average length of record is 25.3 years. This represents a slight decrease in record length compared to 25.5 years in v-3.10, as new short record stations are factored in.

Trends in annual maximum rainfall have not change all relative to the 2020 v-3.10 data. The majority of station data show no statistically significant trend. The table below compares trends in earlier datasets, averaged across all durations. 

Trend in Maximum Rain    v3.20       v3.10       v3.00         v2.30

Significant Increase              4.16%     4.28%       4.18%        4.09%

Significant Decrease             2.25%     2.24%       2.33%        2.30%

No Significant Trend          85.73%    85.80%     85.55%      86.37%

No Calculation                      7.86%      7.68%       7.94%        7.24%


The v-3.20 datasets  have the following trends within various durations:


Excluding 'No Calculation" data, annual maximum observations with 'No Significant Trend' represents 92-94% of series, with an average of 93.0%. Excluding the 'No Calc' data results in an average of 4.5% significant increases and 2.5% significant decreases.

The following chart shows that majority of station data show no statistically significant trend.


There has not been any appreciable change in the annual maximum rainfall trends considering earlier datasets (see v-2.30 to v-3.00 update https://www.cityfloodmap.com/2020/02/annual-maximum-rainfall-trends-in.html)

In Canada, the number of stations with annual series used to derive extreme rainfall statistics continues to increase. A previous post explored how manually-operated climate stations have been declining while this increase occurs (link: https://www.cityfloodmap.com/2020/06/do-we-have-enough-climate-stations-in.html). In 1990 there were only 11,268 station-years of data. Today with 17,133 station-years of data we have 52% more information to guide assessments of extreme rainfall.  

This table summarizes the rise in climate station count and rise in station-years as new data is added.


Some have confused the decline in manual stations with a decline in overall data (see the above post). This chart shows the rise in climate stations with IDF data used for engineering design (orange lines), along with the decline in manual station data (blue bars).


Do We have Enough Climate Stations in Canada To Track Trends in Extreme Rainfall?

Some have suggested that we have lost so many climate stations due to cut backs in the 1990's that we can't accurately detect trends in extreme rainfall.  But many are confusing manual climate stations with the stations that collect rainfall intensity data, often automatically.  The number of stations measuring extreme rainfall has been increasing since 1990.

Declining number of stations was noted in the ECO's report 2018 GREENHOUSE GAS PROGRESS REPORT CLIMATE ACTION IN ONTARIO: WHAT'S NEXT? - (see Appendix D)
https://docs.assets.eco.on.ca/reports/climate-change/2018/Climate-Action-in-Ontario.pdf

CBC New has also referred to this concept in responding to a complaint to the CBC Ombudsman regarding accuracy in reporting on extreme weather trends.  What has been cited as evidence of that decline is the chart in Appendix D in the ECO report above. CBC's Director of Journalistic Standards Paul Hambleton wrote:

"The report suggests several possible reasons for this inconsistency, including issues with data collection: There simply are not enough rain gauges. Rainfall data is collected using rain gauge buckets that can record both amount and intensity of rainfall. After a series of federal budget cuts in the 1990s, there are fewer rain gauge stations across the country than there were 60 years ago."

Fewer rain gauge stations? Or fewer "manual" rain gauge stations?  Yes there is a difference.

What does that chart show?  It summarizes declining manual stations in Canada and is a excerpt from the paper in Atmosphere-ocean An Overview of Surface-Based Precipitation Observations at Environment and Climate Change Canada (Mekis et al., 2018) - https://www.researchgate.net/publication/324041502_An_Overview_of_Surface-Based_Precipitation_Observations_at_Environment_and_Climate_Change_Canada

The chart of manual station count in Canada is Figure 2a in the paper on the left below.
Number of Manual Climate Stations in Canada

This chart has been referred to in discussions on extreme rainfall trends.  For example, in the ECO report this chart has been related to intensity-duration-frequency of isolated localized storms as in the excerpt at right:

Readers of this blog will have seen extensive analysis of the trends in extreme rainfall across Canada, including annual maximum series and intensity-duration-frequency (IDF) trends.  The data used is that of Environment and Climate Change Canada, distributed in the Engineering Climate Datasets.

What do Engineering Climate Datasets show us in terms of number of stations that collect and analyze extreme rainfall and IDF trends - they have been increasing!  And the number of station-years of data has been increasing - that means more long-term data to support more reliable statistical analysis.  Good news. The following table summarizes the trends:

Rainfall Intensity Data in Canada
Number of Climate Stations in Canada With Rainfall Intensity Analysis

The newer datasets include more stations, a 22% increase in station count since 1990. And the number of station-years has increased by 48% since 1990 - that's almost 50% more data to analyze and derive IDF design curves since I graduated and started working in this field.

How have the number of stations with extreme rainfall analysis, increasing since 1990, compared to the number of manual stations decreasing since 1990? See chart below:

Climate stations in Canada - trends, count, type
Number of Climate Stations in Canada - Manual and Intensity-Duration-Frequency Stations.  Manual stations decreasing while IDF stations and number of station-years of data increasing. (note: v2.00 (557 stations) and v3.00 (596 stations) not shown on chart)

The Mekis et al. figure is shown in blue and the IDF station trends in orange. Obviously the decline in manual stations does not relate at all to the trends in IDF stations.  As noted in other blog posts, municipal IDF stations have also proliferated over past decades, complementing the IDF stations charted above.

So when CBC's Paul Hambleton writes: "After a series of federal budget cuts in the 1990s, there are fewer rain gauge stations across the country than there were 60 years ago" he missed an important detail - yes manual stations that are expensive to operate have declined, as we expect.  It makes sense that we have fewer manual climate stations since 1990. 
Technology changes.  A good summary of the changes in equipment is described by Mekis et al. - image above are from the website https://www.wikiwand.com/en/Rain_gauge that describes the history of rain gauges and their evolution.

But what about automated weather stations? And what about the number of stations used to collect extreme rainfall information and rainfall intensities? Has the number of stations that define extreme rainfall decreased since 1990? No.

IDF stations have increased from 532 to 651 stations since 1990, many with longer periods of record - we have more extreme weather data to rely on today!  The CBC and others should clearly be more careful when interpreting data on climate station and extreme rainfall  monitoring.  

Toronto Area Extreme Rainfall Trends - Comparing Engineering Climate Datasets with Future Weather & Climate Study Predicted Trends

Environment and Climate Change Canada's Engineering Climate Datasets summarize observed annual maximum rainfall over various durations from 5 minutes to 24 hours.  Theses series are used to derive IDF tables and charts that describe the intensity, duration and frequency (i.e., return period) of extreme rainfall.  IDF tables are used to support engineering design of storm drainage and wastewater systems, and are used to define rainfall patterns used in hydrologic modelling.

The City of Toronto commissioned Toronto's Future Weather & Climate Driver Study - the 2012 results indicate projected changes in extreme rainfall for a few durations and return periods.  Results of the Outcomes Report are here https://www.toronto.ca/wp-content/uploads/2018/04/982c-Torontos-Future-Weather-and-Climate-Drivers-Study-2012.pdf.  The baseline period for the study is 2000-2009 and statistics are predicted out to 2040-2049.

The Engineering Climate Datasets have been updated in early 2019, including for two Toronto-area climate stations with long records called "Toronto City" and "Toronto International Airport".  The following tables compares the predicted increase in extreme rainfall in the 2012 study with trends in the same statistics from 1990 to 2017 at these two Toronto-area stations.


A key take away is that the Future Weather & Climate Driver Study does not agree with the direction and magnitude of changes in the actual statistics, which are based on real observations (not modelling predictions).  Some actual statistics have been decreasing since 1990, not increasing as predicted int eh study.  When a statistic is increasing, it is at a significantly lower rate that what is predicted in the study.

The following chart compares the past 100 year daily data to the study predictions - the Toronto study seems to have a hockey stick shape, jumping significantly upward by the 2040's which does not match the past trends.


The next chart shows changes in 10 year hourly rainfall. The Toronto study significantly understates the value today, suggesting it will double by the 2040's - the predicted future value has already been in place since the 1990's however.


It is questionable whether the City of Toronto should consider any changes to design criteria for municipal infrastructure considering these future predictions - best to follow ASCE's approach and incorporate flexibility in future design and wait and see with the 'observational method'? - if observations show that there is no change in the statistics, there should be no significant driver in changing design criteria, especially based on models that do not match the magnitude or trend in actual extreme rainfall statistics.

***

Bonus: here are a few more predicted 24 Hour 100 Year rainfall values, also going against the observed trends:


Environment Canada Report Confirms No Overall Change in Extreme Rainfall - Generally Random Ups and Downs - Stated Certainty of Future Shifts Contradicts American Society of Civil Engineer's "Significant Uncertainty"

A new Environment and Climate Change Canada (ECCC) report Canada’s Changing Climate Report https://changingclimate.ca/CCCR2019/ reviews past, observed rainfall extremes https://changingclimate.ca/CCCR2019/chapter/4-0/ and confirms there are no observed changes in extreme rainfall across the country:

"For Canada as a whole, there is a lack of observational evidence of changes in daily and short-duration extreme precipitation."

ECCC predicts increases showing a theoretical probability density function shift (Figure 4.21) where the blue line probability density function represents today's/yesterday's eventt magnitudes and frequencies without climate effects, and red represents with effects (shift right means higher magnitude for any frequency):


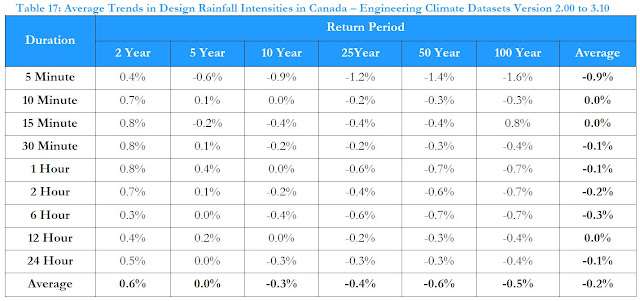
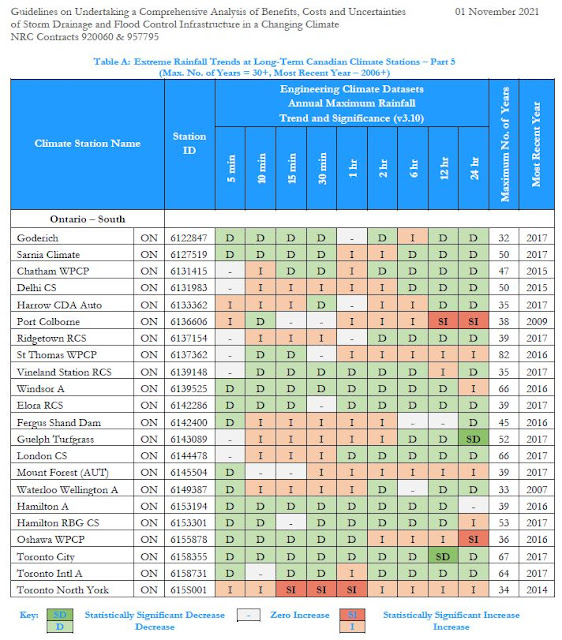
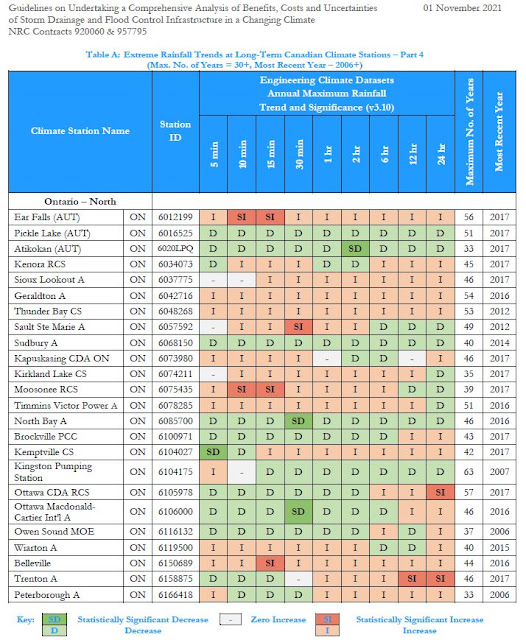
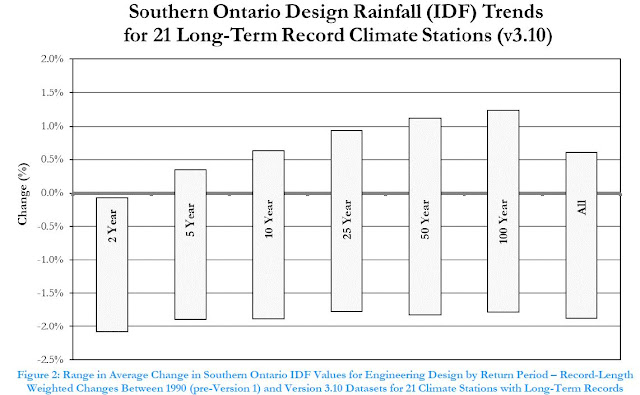
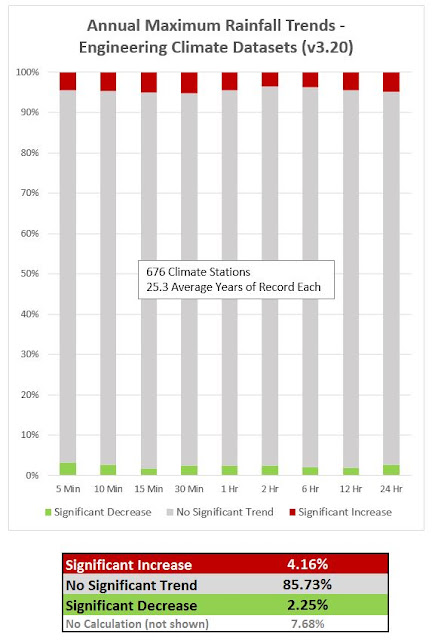
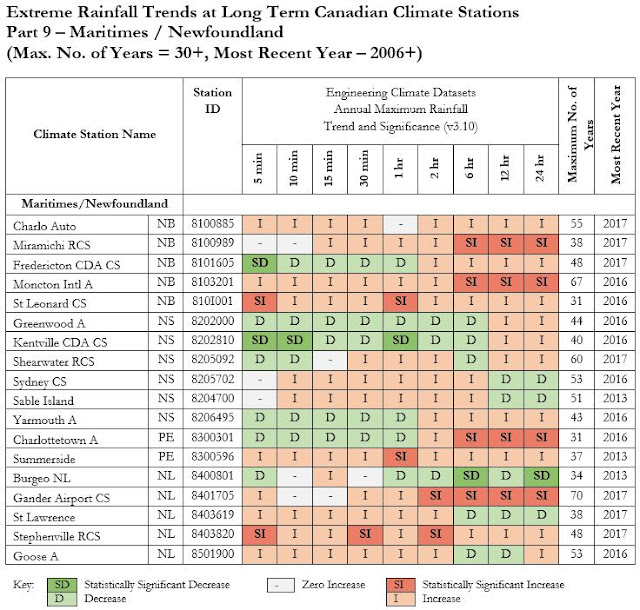
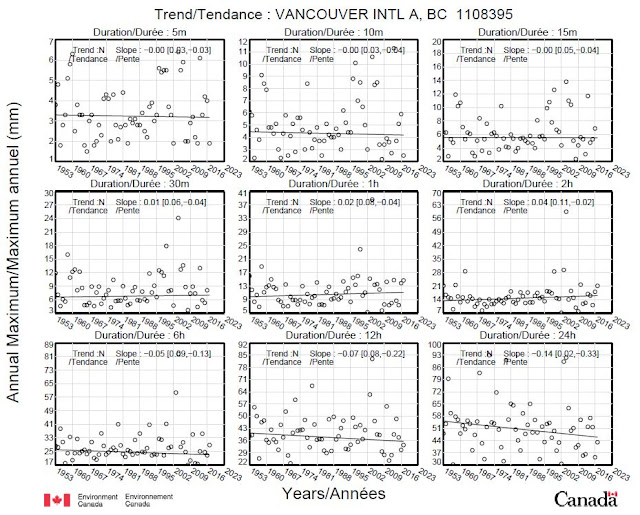
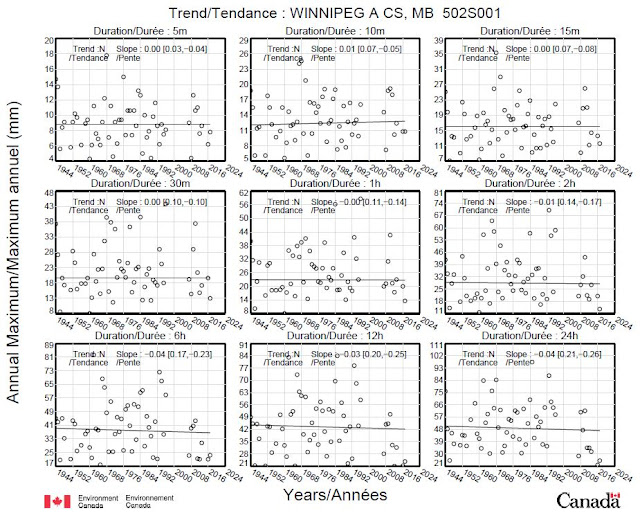
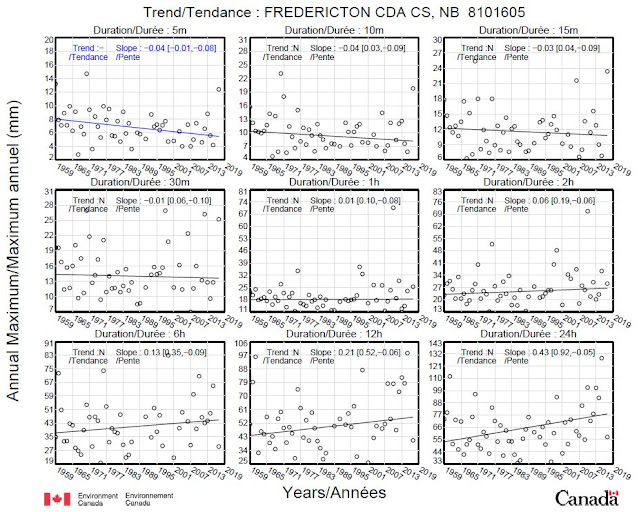
Engineering Climate Datasets in some regions show trends in the magnitude of rain intensity magnitudes (reality) going the other way however:
https://www.cityfloodmap.com/2019/03/idf-updates-for-southern-ontario-show.html .

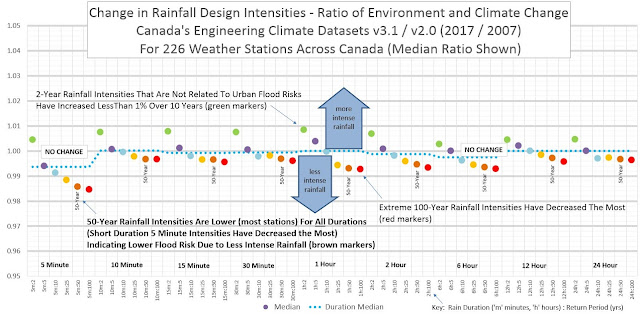
This image shows the difference between the theory and the local data reality - the green line is the REALITY showing for any given frequency (2, 10, 50, 100 Year events) the magnitude is going down in southern Ontario:

ECCC suggests there is insufficient data to observe the changes in extremes expected: "Estimating changes in short-duration extreme precipitation at a point location is complex because of the lack of observations in many places and the discontinuous nature of precipitation at small scales." - while that MAY be accurate for extreme events that are rare and elusive, why do 2 Year rain intensities, derived from many, many yearly observations at all long term rain gauges, show the clearest decline, across all durations from 5 minutes to 24 hours?

Surely, we have DO enough point locations and observations to see the change in these small storms. But if these small frequent storm intensities are no higher with today's temperature shifts, why do we expect the extremes to be higher either? Data we do have shows in southern Ontario these 100 year intensities are 0.2% LOWER on average. So extremes are shifting shifting along with the means.... shifting lower.

A theoretical probability density function shift has been promoted in the past by ICLR and IBC in the 2012 Telling the Weather Story report:


This has been shown to be 'made-up' and not related to real data (ECCC IDF tables and charts mistakenly cited as the source of the 40 year to 6 year frequency shift) - this chart shows the theoretical 1 standard deviation shift widely circulated by IBC and real data shifts:

See the difference between theory and data? It is pretty clear.

Given the lack of past trends, and uncertainty in future noted in the ECCC report ("It is likely that extreme precipitation will increase in Canada in the future, although the magnitude of the increase is much more uncertain"), we must follow the American Society of Civil Engineer's recommended "Observational Method" approach see 2015 report Adapting Infrastructure and Civil Engineering Practice to a Changing Climate at http://theicnet.org/wp-content/uploads/2015/07/2015-07-ASCE-Practice-to-Climate-Change-2015.pdf, and also see https://ascelibrary.org/doi/book/10.1061/9780784415191?utm_campaign=PUB-20181023-COPRI%20Alert&utm_medium=email&utm_source=Eloqua# for the new 2018 manual on engineering practice Climate-Resilient Infrastructure, Adaptive Design and Risk Management.

The ASCE 2018 manual promotes incorporating any no-regret, now cost measures in design today considering most probable future conditions, and allowing design flexibility to adapt in the future if and when performance is shown to be inadequate or affected by future changes - this is a practical approach intended to avoid costly over-design, and over-investment in potentially unnecessary and cost-ineffective infrastructure today.

While the ASCE 2015 report notes the high degree of uncertainty "However, even though the scientific community agrees that climate is changing, there is significant uncertainty about the location, timing and magnitude of the changes over the lifetime of infrastructure."

In contrast, the ECCC report appears to asset a high degree of confidence in future changes saying "For Canada as a whole, there is a lack of observational evidence of changes in daily and short-duration extreme precipitation. This is not unexpected, as extreme precipitation response to anthropogenic climate change during the historical period would have been small relative to its natural variability, and as such, difficult to detect. However, in the future, daily extreme precipitation is projected to increase (high confidence). - how can ECCC assert high confidence when there are no observed trends? How can ECCC contradict ASCE's statement on high "signifcant uncertainty'?

ECCC reports that summer precipitation is expected to decrease: "Summer precipitation is projected to decrease over southern Canada under a high emission scenario toward the end of the 21st century, but only small changes are projected under a low emission scenario." - how can that be if the summer temperatures are going up? Does this not violate the Clausius-Clapeyron theory cited in the ECCC report states that "increased atmospheric water vapour in this part of the world should translate into more precipitation, according to our understanding of physical processes" - so that is a theory - what about the real data? What does it show? the Clausius-Clapeyron relationship does not stand up to scrutiny as shown in a previous post.

Given highest rainfall extreme are in the summer (see the work of Dr. Trevor Dickinson on seasonal extremes), a summer decrease in precipitation could potentially mean lower flood risks. The data for southern Ontario already show a decrease in the annual maximum series (reflecting lower means and typical 2 Year design intensities in derived IDF curves) and the extreme 100 Year design intensities are decreasing slightly as well.

Overall, many in the media have over-hyped concerns about changing rainfall severity. Data and ECCC's report shows there has been no change, beyond random fluctuation. Looking ahead the American Society of Civil Engineers indicates that future changes have "significant uncertainty"- this contracts the ECCC's statement on "high confidence" on future extremes.