I have posted comments on three TVO Articles on the topic of climate change, extreme weather, urban flooding and resiliency of Ontario Cities. Readers of this blog will be familiar with the content. It gets a bit repetitive from article to article, only because the data gaps are the same old ones we always see on these topics. BONUS: a recent TVO broadcast is reviewed at the end of this post.
1) How climate change is making storms more
intense, Published on Apr 21, 2017 by Tim Alamenciak
https://tvo.org/article/current-affairs/climate-watch/-how-climate-change-is-making-storms-more-intense
My Comments:
This is absolutely
incorrect. Environment and Climate Change Canada (ECCC) published in
Atmosphere-Ocean in 2014 that there is "no detectable trend signal"
in the Engineering Climate Datasets related to short-duration rainfall that
causes urban flooding:
Windsor has the lowest
level of service for floodplain protection (100 year storm) while other regions
have Hurricane Hazel (over 500 year storm) - so Windsor / Essex region will
flood a lot more that other places. Also Windsor has been effectively
tightening up their sanitary sewers to prevent spills to the river (reduced
combined sewer overflows (CSOs)) which means more stays in the sewers and can back-up
basements in extreme weather. Its a tough trade-off when environmental
protection (keeping sewage out of the river) means more sewage in basements.
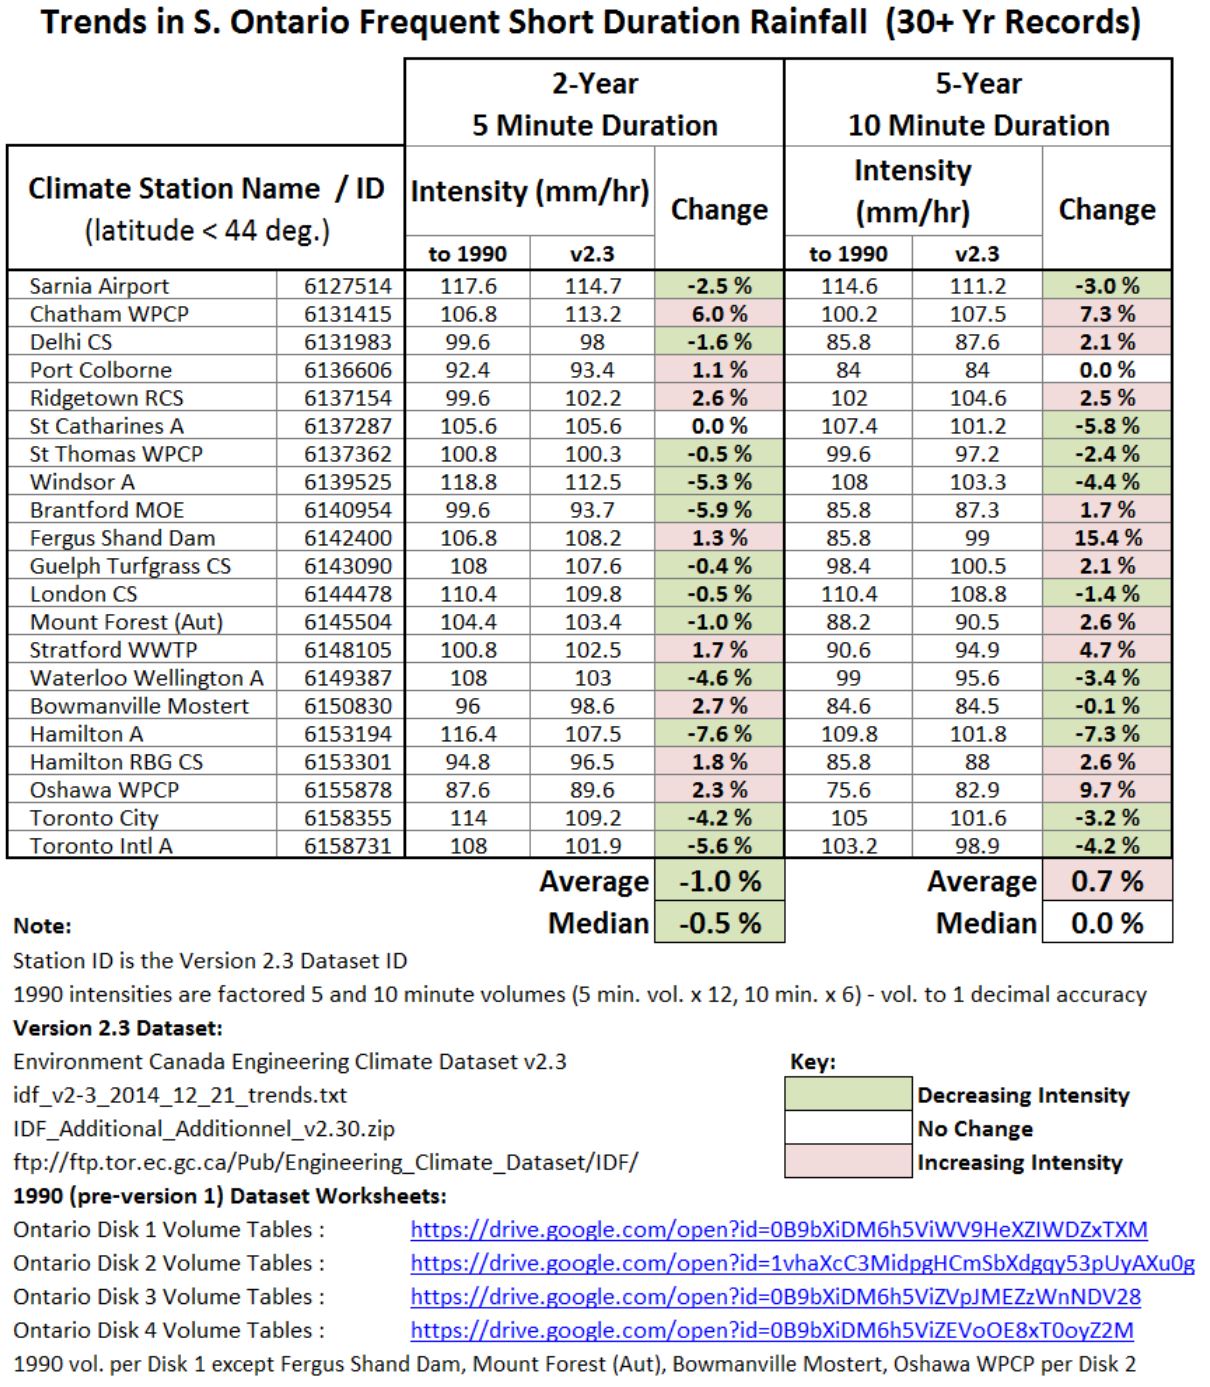
This is a recent summary
of ECCC data as well as studies my Ontario universities and major engineering
consultants saying decreases in extreme rainfall in Ontario. In fact there are
twice as many statistically significant decreasing trends as increasing ones in
southern Ontario (per the version 2.3 Engineering Climate Datasets - links to
ECCC data files are all provided on the slides:
This presentation to the Ontario Waterworks Association and Water Environment Association of Ontario's Joint Climate Change Committee does extensive myth-busting related to extreme rainfall and flooding and explore the true drivers to increased flood events (spoiler-alert: its engineering hydrology and hydraulics, not meteorology). It also shows how the Clausius-Clapeyron relationship (theory relating temperature to extreme rainfall) has been disproved by research at MIT, Columbia and the University of Western. Unfortunately, there are lot of opinions and high level statements that are made without data. This is a pervasive problem in the media. When fact checking does occur, Advertising Standards Canada, the CBC Ombudsman and Canadian Underwriters have all agreed that there is no change to extreme rainfall. Here are some examples of that:
More data / facts / details:
Windsor decreasing extreme
rainfall trends (Engineering Climate Datasets version 2.3 Station ID 6139525) -
decreasing for ALL storm durations, and statistically significant decreases for
durations of 10 minutes, 2 hours, 6 hours and 12 hours:
CBC Ombudsman confirms
with ECCC, and disputes insurance industry statements that we have more storms
(see letter to me):
http://www.cityfloodmap.com/2015/10/bogus-statements-on-storms-in-cbcnewsca.html
That was in response to this story that had no fact-checking:
And which had this correction made based on ECCC and real data: "However, Environment Canada says it has recently looked at the trends in heavy rainfall events and there were "no significant changes" in the Windsor region between 1953 and 2012." Canadian Underwriter editors dispute insurance industry statement on more frequent / severe storms after fact-checking with ECCC:
"Associate Editor’s
Note: In the 2012 report Telling the Weather Story, commissioned to the
Institute for Catastrophic Loss Reduction by the Insurance Bureau of Canada,
Professor Gordon McBean writes: “Weather events that used to happen once every
40 years are now happening once every six years in some regions in the
country.” A footnote cites “Environment Canada: Intensity-Duration-Frequency
Tables and Graphs.” However, a spokesperson for Environment and Climate Change
Canada told Canadian Underwriter that ECCC’s studies “have not shown evidence
to support” this statement."
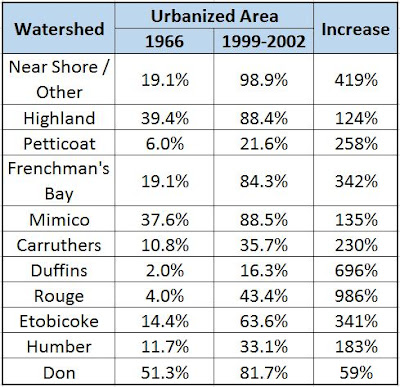
We can explain most
increased flooding by hydrological changes over the past 100 years (same rain a
before but more runoff than before as urban areas have expanded drastically
across GTA watersheds over the past 60 years):
http://www.cityfloodmap.com/2016/08/urbanization-and-runoff-explain.html
... and specifically here is are the changes in hydrology in southern Ontario cities
including the Windsor area:
We can also explain
increased flooding with hydraulics related to municipal drainage design (tanks
to hold back water and protect beaches can back up into basements like in my
Toronto "Area 32" engineering flood study report), and related to overland
flow in 'lost rivers' that statistically explain the highest concentrations of
reported basement flooding:
Basically, hydrologic
stresses have increases (more runoff) and conveyance capacity has decreased
(reduced CSO relief, tanks to protect beaches, blocked overland flow paths in
old 'lost rivers'). Underpinned/excavated basements are now lower than before,
closer to the crown of the sewer pipes in the street and more prone to sewage
back-ups than before, with no change in rainfall extremes due to climate change.
Robert J. Muir, M.A.Sc.,
P.Eng.
Toronto
2) How climate change is already costing you money,
Published on Nov 01, 2017 by Patrick Metzger
https://tvo.org/article/current-affairs/climate-watch/how-climate-change-is-already-costing-you-money
My Comments:
There are many false
statements in this article and a lack of basic science, statistics or critical
engineering considerations. I am a licensed Professional Engineer with
extensive experience in extreme weather statistics and municipal infrastructure
planning and design (26 years) - this article is like 100's of others, skimming
the surface and missing the critical data and conclusions, reinforcing stale
pundit talking points in the climate-change-echo-chamber. Please see below for
what is wrong with the article.
Firstly, the article
conflates climate and weather which have different temporal scales. Climate
includes rainfall and precipitation over seasons, years and decades while
weather related to flooding in urban areas involves rainfall over minutes and hours.
So the cited increase in precipitation is irrelevant to urban flooding and
insurance since precipitation trends over months and years do not govern the
performance of infrastructure systems (storm sewers, sanitary sewers, drainage
channels and overland flow paths) - that infrastructure is governed by extreme
rainfall rates over minutes and hours. It is an undeniable engineering fact.
And these short duration rainfall intensities are 'flat' across Canada
according to Environment and Climate Change Canada, as published in
Atmosphere-Ocean in 2014 - in fact ECCC stated that some regions have
decreasing trends including the St Lawrence basin in Quebec and the Maritimes.
My own fact checking of
the Engineering Climate Datasets (version 2.3 on the ECCC ftp site) shows twice
as many statistically significant decreases in southern Ontario as increases,
and for the critical shortest durations, no statistically significant increases
at all. Here is a review of the typical insurance industry statements and the
real data:
Over the past two weeks I
have correspondence from 3 scientists at ECCC stating that the annual
precipitation statistic (climate) is irrelevant to urban flooding and the short
duration rainfall (extreme weather) is what we should be looking at - across
Canada the relevant data shows 'no detectable trend signal'. TVO should check the background of those providing information for these articles to see if the academic and practical experience aligned with the technical topic being discussed.
It is too easy to just try
and may headlines and exercise 'availability bias', 'anchoring bias' and other
problem-solving short cuts with discussing extreme weather and flooding. It is
more responsible to look at real data and fact-check articles because there is
important public policy on climate adaptation and mitigation that relies on the
proper characterization of the problems that we are solving. Blaming flooding
on rainfall trends misdirects resources to mitigation when it should be focused
on adaptation to yesterday's extremes (due to intrinsic design limitations in
50-100 year old infrastructure and land use planning). Chief economists at
major banks have repeated IBC statements on extreme weather shifts with no fact
checking whatsoever - the Sun, the Star, CBC and individual insurance companies
have repeated it too without checking. They have been fact checking with ECCC
recently though and the consensus is that there is no shift in extreme rainfall
and IBC mixed up a theoretical future shift (of an arbitrary 'bell curve' no
less) and had reported it extensively as a past observation by ECCC. ECCC has
denied that their data shows any increase in severe weather with climate change.
Some examples of ECCC
refuting insurance industry claims:
Ombudsman confirms with ECCC, and disputes insurance industry statements that we have more storms (see letter to me):
That was in response to
this story that had no fact-checking:
http://www.cbc.ca/news/canada/windsor/more-than-half-of-homeowners-insurance-claims-stem-from-water-damage-broker-says-1.3291111
And which had this correction made based on ECCC and real data: "However, Environment Canada says it has recently looked at the trends in heavy rainfall events and there were "no significant changes" in the Windsor region between 1953 and 2012."
Canadian Underwriter
editors dispute insurance industry statement on more frequent / severe storms
after fact-checking with ECCC:
"Associate Editor’s
Note: In the 2012 report Telling the Weather Story, commissioned to the
Institute for Catastrophic Loss Reduction by the Insurance Bureau of Canada,
Professor Gordon McBean writes: “Weather events that used to happen once every
40 years are now happening once every six years in some regions in the
country.” A footnote cites “Environment Canada: Intensity-Duration-Frequency
Tables and Graphs.” However, a spokesperson for Environment and Climate Change
Canada told Canadian Underwriter that ECCC’s studies “have not shown evidence to
support” this statement."
Lastly, the Clausius-Clapeyron
relationship linking temperature to extreme rainfall have been shown to not
hold up based on real observed data. This is a review of those findings in
studies from MIT, Columbia and University of Western (in London and Moncton
trends are flat, while in Vancouver there is less extreme rainfall at higher
temperatures):
Its time for a lot more
basic fact checking on climate change, extreme weather and flooding. There is
too much 'thinking fast' and not enough 'thinking slow', as shown in this
review of media reporting biases through the lens of Kahneman:
http://www.cityfloodmap.com/2015/11/thinking-fast-and-slow-about-extreme.html
Unfortunately, as Kahneman puts it ""People are not accustomed to thinking hard, and
are often content to trust a plausible judgment that comes to mind.", American Economic Review 93 (5) December 2003, p. 1450
"Only the small
secrets need to be protected. The big ones are kept secret by public
incredulity."(attributed to Marshall McLuhan) .. .so true, especially when
we rely on infographics and slogans and ignore basic data in our reporting.
Robert J. Muir, M.A.Sc.,
P.Eng.
Toronto
3) How Ontario cities battle climate change, Published
on Dec 01, 2015 by Daniel Kitts
https://tvo.org/article/current-affairs/the-next-ontario/how-ontario-cities-battle-climate-change
My Comments:
Mr Adams is correct is
questioning Mr Kitts 'facts'. Because the official national Engineering Climate
Datasets show no detectable trend in extreme rainfall in Canada. This was
published in Atmosphere-Ocean in 2014 and looks at the critical short duration
rainfall rain intensities that drive urban flooding. Here is a review that
explore that national data in detail, drilling down to Ontario and southern
Ontario trends and showing why insurance industry statements on higher weather
frequency shifts were exposed to be 'made up' (confusing arbitrary future
predictions with past observations):
Citing IPCC is irrelevant
in the context of urban flooding in Ontario cities .. IPCC's definition of
'heavy rainfall' is the 95% percentile of daily rain with in Toronto is about
29 mm of rain - that is big for 'climate' but tiny for 'weather'. Typically
storms have to be 3 times that big to cause urban flooding and most new
communities are designed to handle 100-year design storms with built-in
resiliency measures / safety factors to handle larger storms (if we see a
hockey stick and get more extreme rain in the future).
Recently I made
presentation to the Ontario Waterworks and Water Environment of Ontario's Joint
Climate Change Committee on city resiliency and adaptation. In it there is
wealth of basic media myth-busting many would benefit from. It includes
explanations of why we have more flooding from a quantitative engineering perspective,
exploring hydrologic stresses and intrinsic hydraulic design limitations in
50-100 year old infrastructure and land use planning:
It shows for example that
2017 Lake Ontario levels, while above average, were not very extreme looking
back at 100 years of record (we exceeded past records by about 5 cm in some
months which is naturally what happens with longer and longer records and the updated
operating 'rule curves' for the lakes). It shows that the Richmond Hill GO
Train was flooded in 1981 (just like 2013) in the exact same spot, even though
the Ontario government suggests the 2013 flood was due to climate change. It
shows that during the highest short duration rainfall recorded in Toronto in
1962 there was extensive basement and roadway flooding (this is not a new
phenomenon at all). It shows numerous studies at the University of Guelph,
University of Waterloo and major engineering consultants that Ontario extreme
rainfall in decreasing and that extreme rainfall is not coupled to temperature
changes. It shows significant urbanization in Oakville, Burlington and the rest
of the Golden Horseshoe wince the 1960's and how we have paved up to the upper
limit of the Burlington escarpment headwater watershed in that time - its
hydrology that explains the increased flooding, not meteorology! This blog post
shows the drainage paths in Burlington a little better than the OWWA WEAO
presentation at the link above:
These change in hydrology
and runoff potential are undeniable and dwarf any noise in the extreme rainfall
statistics. The 'new normal' is in fact the 'old extremes' that we have always
had .. the system response is more severe however with greater runoff into the
same 50-100 year old infrastructure and confined channels along the lower
portions of our watersheds. When it comes to urban flooding, only Milli Vanilli 'Blame it on the Rain'. Nobody cares about hydrology. Canada's greatest hydrologist Vit Klemes once lamented about this saying If you have not read it, please see his key note address to International Interdisciplinary Conference on Predictions for Hydrology, Ecology, and Water Resources Management: Using Data and Models to Benefit Society, entitled "Political Pressures in Water Resources Management. Do they influence predictions?"
Basically you could say
that today on Ontario it is not unlike the communist Czech Republic that Dr
Klemes describes in his address, where predictions (climate change) becomes
prescriptions, despite the facts and data. And the media is so far out of touch that we cannot put the
genie back in the bottle and the government is playing along pretending to help
solve problems while ignoring true causes.
As our Dr Klemes spoke in
Prague:
"[the theorists] find it easier to play trivial scenario-generating computer games while the [managers] find these games much easier to finance... And so by happy collusion of interests, an impression is created that 'something is being done for the future' while the real problems are quietly allowed to grow through neglect of the present"
That is 100% correct. We are ignoring the present risks of today related to hydrology and
blaming our flood problems on a climate change computer game (Weather Zoltar if
you will). RIP Dr Klemes .. I still remember your guest lecture in our undergraduate class and wish you were around to speak truth to power on this topic.
TVO you have to raise the
bar on this topic and demand basic fact checking especially given ECCC
statements, corrections by Advertising Standards Canada, CBC Ombudsman, Canadian
Underwriters ....
Robert J. Muir, M.A.Sc.,
P.Eng.
Toronto
***
Recently TVO aired a segment on extreme weather reporting and examined temperatures submitted by a viewer to show that Ottawa maximum temperatures have been decreasing using WeatherStats.ca data. See broadcast: https://www.tvo.org/video/climate-accuracy-activism-and-alarmism, and the transcript: https://www.tvo.org/transcript/2550125/climate-accuracy-activism-and-alarmism. This chart was questioned:
The TVO panelists could not comment on the source of the chart and dismissed it (even through the viewer had supplied TVO with the source). One panelist presented a chart on average temperatures (not maximum values) over a shorter period and seemed to imply that any Ottawa trends were an anomaly. Here is that chart:
What does the TVO panelist chart miss? Maximum temperatures. The hot decades in the early 1900's. The following chart is based on Environment and Climate Change Canada's homogenized and adjusted data - they do not produce annual maximum daily temperatures so this picked the highest daily temperatures for each year, just like the TVO viewer charted using WeatherStats.ca data. Here is the official data maximums:

Note: title station number is 61005976 is corrected (previous version indicated 6105967) - May 7, 2022
There is the same pattern and decreasing trend that the TVO panels dismissed! Maybe instead of inviting just lawyers and doctors as its panelists TVO could invite some engineers to comment on data that is most relevant to our profession?
The following chart shows that for all Ontario stations with trend data available summers are not warming as much as the winters - and Octobers are getting colder.
In Ottawa, data from the Ontario Centre for Climate Impacts and Adaptation Resources shows winter temperatures increasing, driven by the minimum increasing (as noted in a previous post):
 |
| Winter temperatures have increased with climate change - Ottawa, 1939-2016 |
Yet summer maximum temperatures have not increased at all (centre chart) - the mean (left chart) is increasing due to the minimum (right chart) increasing:

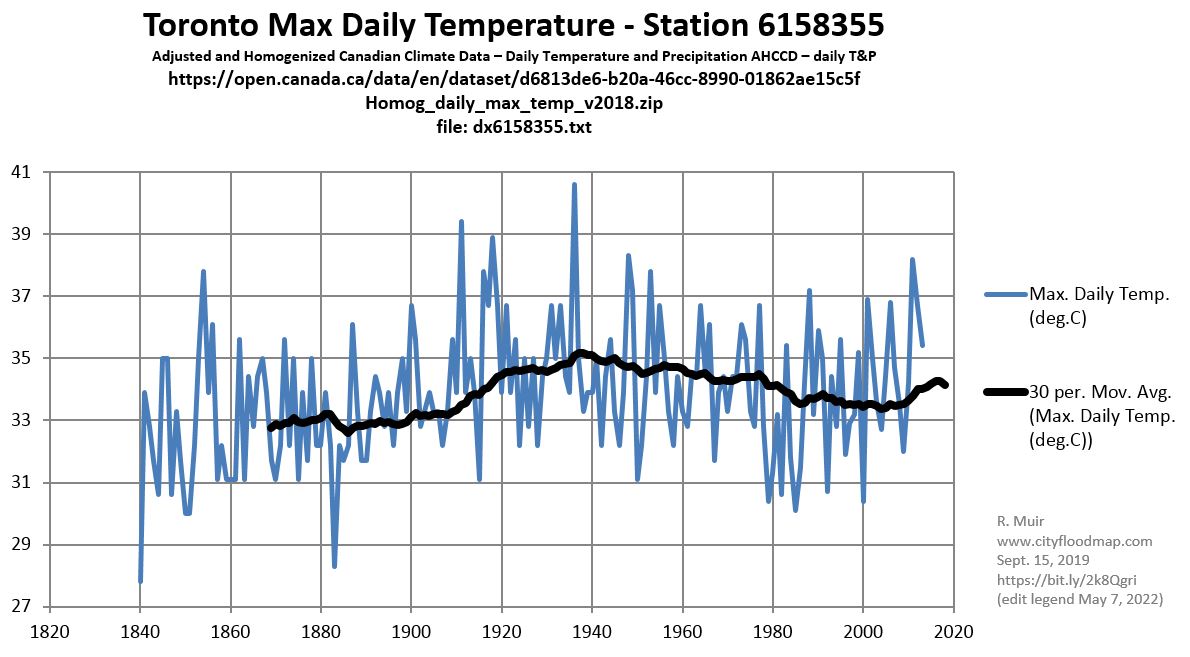
Other locations across Ontario have decreasing annual maximum temperatures since the 1930's as well. In Toronto the moving average 30 year annual maximum temperatures have decreased since the 1920's - the periods including the 1930's had high maximum temperatures:
Note: legend updated label series May 7, 2022
Some Toronto temperatures changes may be explained by urban heat island (UHI) effects, meaning heat is absorbed by urban structures and surfaces, and is stored and radiated back. Research at the University of Toronto has suggested that UHI explains a portion of the temperature increase by comparing trends with other rural climate stations not affected by UHI (see Tanzina thesis 2009). Tanzina summarized trends in temperatures by season showing that summer warm days decreased at many Toronto-area stations (highlighted climate stations):
What about across Canada? Other major cities such as Calgary have had decreasing annual maximum temperatures trends as well. This chart shows data from weatherstats.ca which no increase in maximum temperatures:
Environment and Climate Change Canada's homogenized and adjusted data for Alberta show a trend similar to Ontario, meaning warmer mean temperatures due mostly to warmer winters and not summers. These are mean temperature trends by month:
So summers are slightly warmer considering the mean and warmer minimums. But the maximum temperatures in summer (July) have DECREASED, and so have October and November maximum temperatures:
 So the month with the highest temperatures is having a decrease in maximum temperature. The chart at right shows climate normals for Calgary, with July temperatures being the highest. This is good news that maximum temperatures in the hottest month are declining according to the official national climate datasets.
Ross McKitrick found some similar trends looking across Canada: https://www.rossmckitrick.com/uploads/4/8/0/8/4808045/temp_report.pdf
Some of his take-aways:
"4. Over the past 100 years, warming has been stronger in winter than summer or fall. October has cooled slightly. The Annual average daytime high has increased by about 0.1 degrees per decade. 72 percent of stations did not exhibit statistically significant warming or cooling.
5. Since 1939 there has been virtually no change in the median July and August daytime highs across Canada, and October has cooled slightly."
***
How about a look at July maximum temperatures in the Toronto area? Are summers getting hotter?
The adjusted and homogenized data are available from Environment and Climate Change Canada:
https://www.canada.ca/en/environment-climate-change/services/climate-change/science-research-data/climate-trends-variability/adjusted-homogenized-canadian-data.html
To review, follow the "Surface air temperature" link and download the monthly data, i.e., the file Homog_monthly_max_temp.zip that includes all station data. The data can be evaluated to show trends over 100+ years in several cases.
The following chart shows the maximum daily temperatures in July, averaging all days, for climate stations in Welland, Vineland, Hamilton, Toronto, Peterborough and Belleville including records up to 100 years (2019-2018):
The Station IDs and names are as follows: 6139148,VINELAND; 6166415, PETERBOROUGH; 6158355, TORONTO; 6139449, WELLAND; 6150689,BELLEVILLE; and 6153193,HAMILTON. Three stations have decreasing temperature trends and three have increasing trends. On average, over 100 years, the maximum July temperatures have increased by 0.17 degrees Celsius for these six stations.