Showing posts with label IDF curves. Show all posts

Has Extreme Rainfall Become More Severe in Canada? - Research Shows Rain Intensities Mostly Unchanged (Stationary)

A research paper Assessment of non-stationary IDF curves under a changing climate: Case study of different climatic zones in Canada in the August 2021 Journal of Hydrology: Regional Studies by Silva et al. evaluated trends in historical annual maximum rainfall across Canada for a range of durations at climate stations with long-term records (over 50 years) (link: https://www.sciencedirect.com/science/article/pii/S2214581821000999). Projected future IDF curves are discussed in a future post.
Regarding observed rainfall maxima, the paper comments on the lack of consistent trends observed:
"There is no clear spatial pattern of trend in precipitation among the considered regions of Canada. Only the Moncton station shows a significant non-stationary behaviour in GEV modelling over most of the durations. No change pattern (i.e., trend detection) is confirmed for all durations at two sites under the influence of Great Lakes (London and Hamilton)."
The following Table 2 excerpt from the paper shows where annual maximum precipitation is stationary (not changing, as noted with the symbol "I") and non-stationary (changing) over the observation period.

Table 2. The best GEV model for each station and different durations in the historical period*.

Duration (minutes)Selected Station
CalgaryHamiltonLondonMonctonVancouverWinnipeg
5IIIIII
10VI (0.030)IIIIII
15IIIVI (0.043)II
30IIIV (0.030)II
60IIIII (0.003)II
120IIIVII (0.047)II
360IIIII (0.041)VII (0.011)I
720II (0.036)IIII (0.016)II
1440IIIII (0.002)IVII (0.025)

The best GEV model is shown using I to IX, according to the list of models in Appendix A. I corresponds to the stationary model, while values from II to IX correspond to the non-stationary models.

In central Canada, 26 of 27 rainfall series of maximum rainfall over durations of 5 minutes to 24 hours for Hamilton, London and Winnipeg stations were stationary, i.e., unchanged. The Great Lakes region represented by London and Hamilton, where no change in annual extreme rainfall was observed, also includes several large urban centres. 
A previous post evaluated Environment and Climate Change Canada annual maximum rainfall trends for 676 climate stations across Canada: https://www.cityfloodmap.com/2021/10/annual-maximum-rainfall-trends-in.html
There were few statistically significant trends, up or down, in the most recent v3.20 datasets, as noted in the following chart:
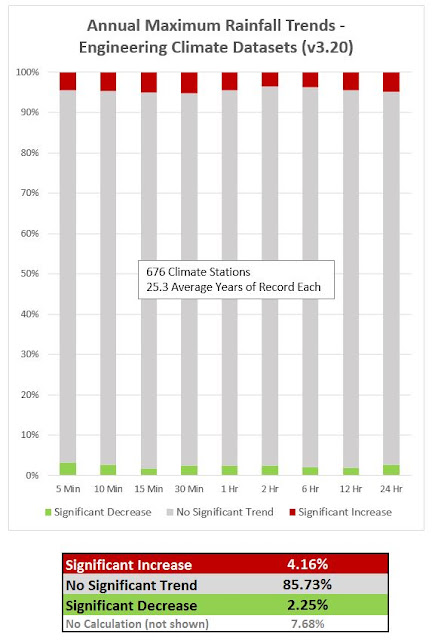
This summary table below shows that earlier datasets had similar trends with the majority of trends (i.e., over 90% of stations with calculations available showed no significant trend):

Trend in Maximum Rain    v3.20       v3.10       v3.00         v2.30
Significant Increase              4.16%     4.28%       4.18%        4.09%
Significant Decrease             2.25%     2.24%       2.33%        2.30%
No Significant Trend          85.73%    85.80%     85.55%      86.37%
No Calculation                      7.86%      7.68%       7.94%        7.24%

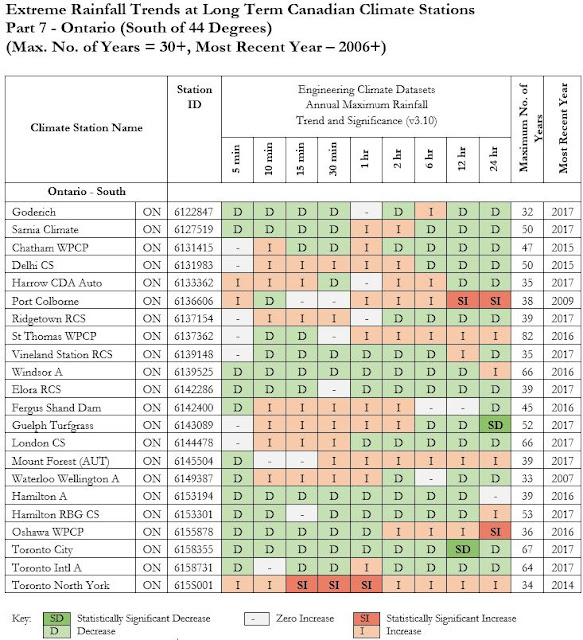
Looking at particular regions such as Southern Ontario and Manitoba where stationary annual maximum rainfall was observed in the paper above, one can see the variability in trends and significant across different stations and durations.

Southern Ontario, including the Hamilton and London stations has more decreasing trends than increasing ones:

In Manitoba, the trends vary by station with some recording increases over all durations with other recording decreases. Winnipeg has a combination of decreases, no change, and an increase for the 9 durations evaluated as shown below:
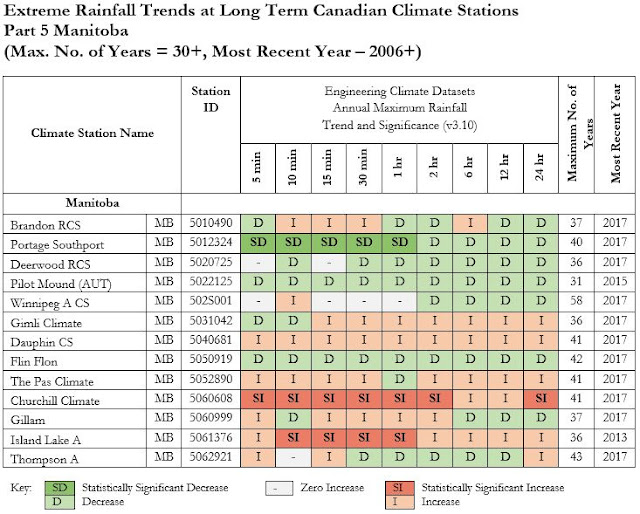

These trends are as reported in Environment Canada's v3.10 Engineering Climate datasets and will be published for all regions in the upcoming National Research Council of Canada cost benefit guideline for flood control infrastructure in a changing climate.

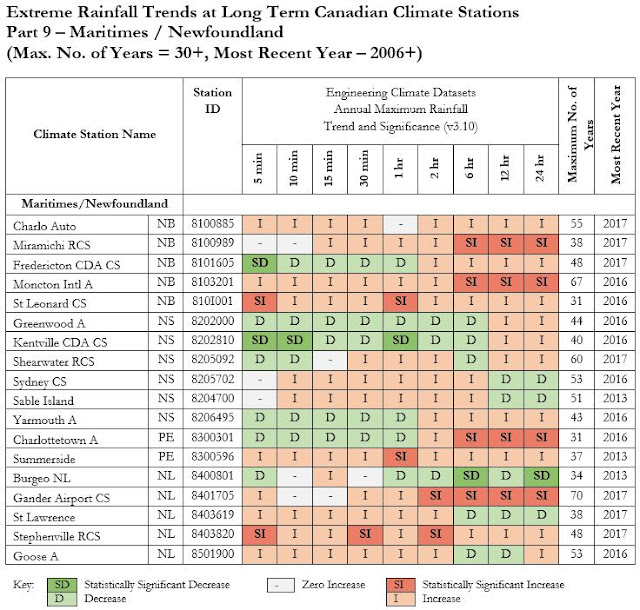
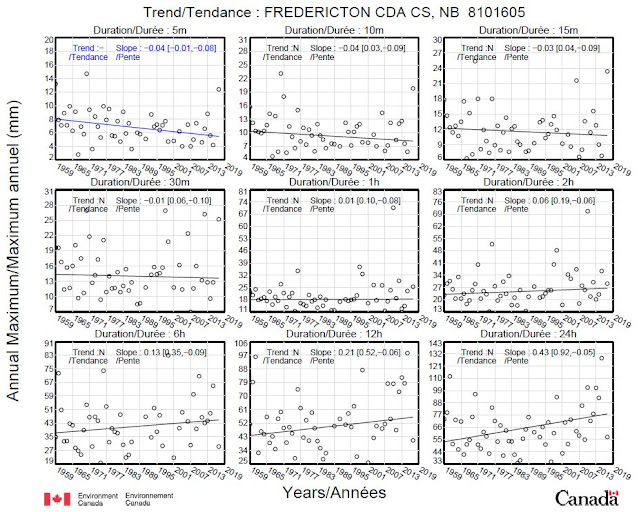
The tables above suggest that evaluating single stations may not provide a complete picture of overall changes in a region. For example, the paper highlights the non-stationarity in Moncton annual maximum rainfall. Other long term stations in New Brunswick, such as Fredericton have some trends that are opposite to those observed in Moncton (i.e., the Fredericton station has more decreasing trends than increasing ones and a statistically significant decrease), and others do not exhibit as strong increasing trends (e.g., the Charlo Auto station does not have the same number of statistically significant increases as Moncton and its 1-hour rainfall has not increased). Therefore Moncton is not representative of other long-term New Brunswick station trends.

The following charts show the v3.20 annual maximum series trends for the six stations studied in the paper, i.e., Calgary, Hamilton, London, Moncton, Vancouver and Winnipeg.

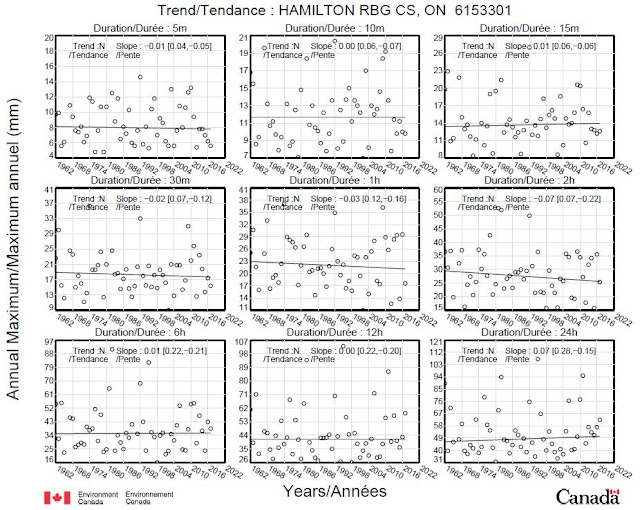
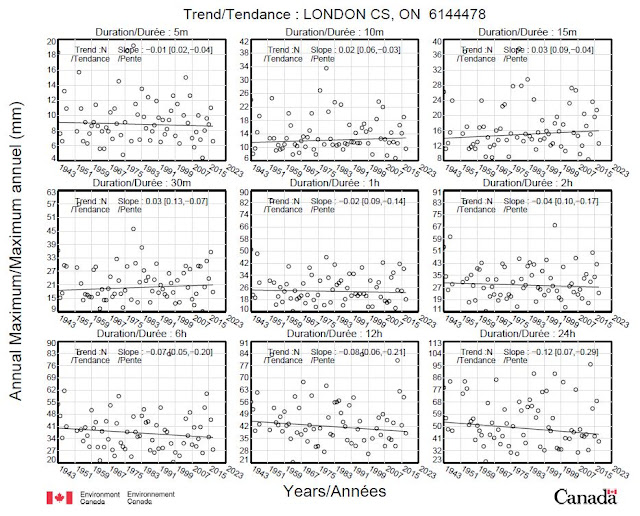
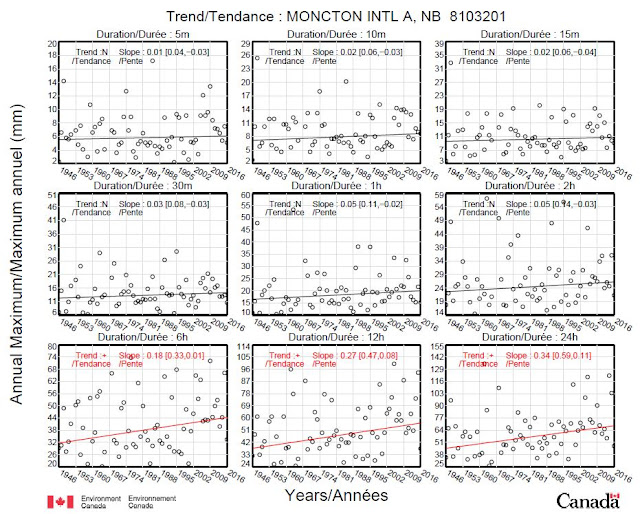
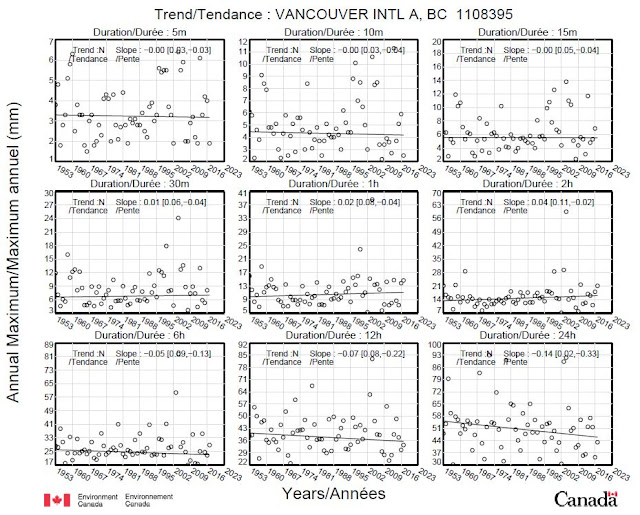
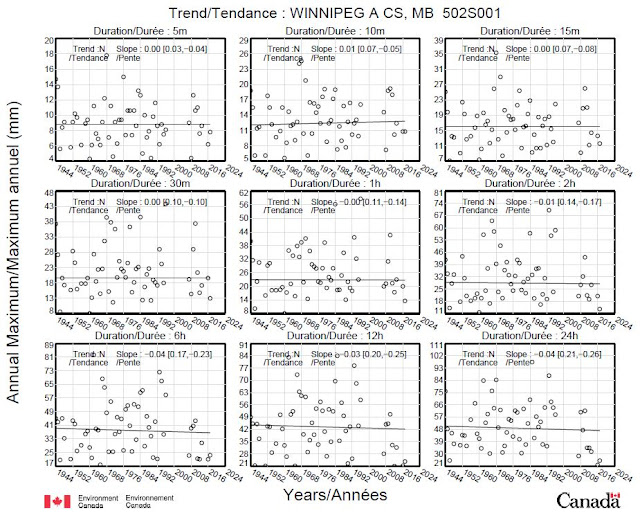

Only Moncton 6, 12 and 24-hour series have statistically significant increases. As noted above, Fredericton has observed decreasing trends as well, including a statistically significant decrease in 5-minute annual maximum rainfall, and no statistically significant increases:

Ultimately, annual maximum rainfall series are used to derive design rainfall intensities (IDF curves) by fitting a probability distribution to observed annual maxima. A previous post demonstrated how IDF values changed following the addition of recent observations (link:  https://www.cityfloodmap.com/2020/07/how-have-rainfall-intensities-changed.html):
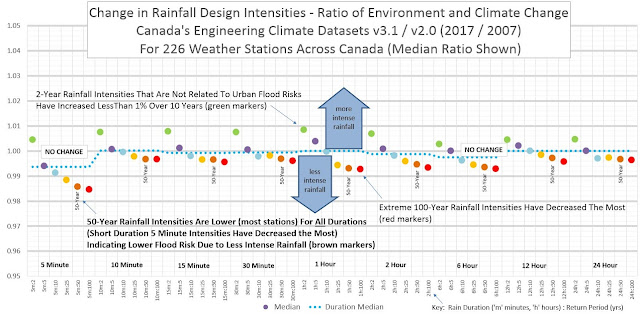

On average, extreme intensities (red dots represent 100-year intensities) have decreased slightly for all durations. Less extreme intensities (green dots represent 2-year intensities) have increased slightly. Regions have different trends, sometimes with short duration intensities increasing and long-duration intensities decreasing, and vise versa as shown in another post: https://www.cityfloodmap.com/2020/07/can-we-use-daily-rainfall-models-to.html

***

The paper also presents future rainfall intensity projections that will be reviewed in an upcoming post. A review of projected results, included in supplemental material but not the main document shows that under some emissions scenarios (i.e., representative concentration pathways), rainfall intensities are projected to decrease in Ontario. The main document only presents projections for a high emissions scenario (RCP8.5) that has been questioned in terms of its likelihood by the Pacific Climate Impacts Consortium (see Science Brief: https://www.pacificclimate.org/sites/default/files/publications/Science_Brief_39-June_2021-final.pdf)
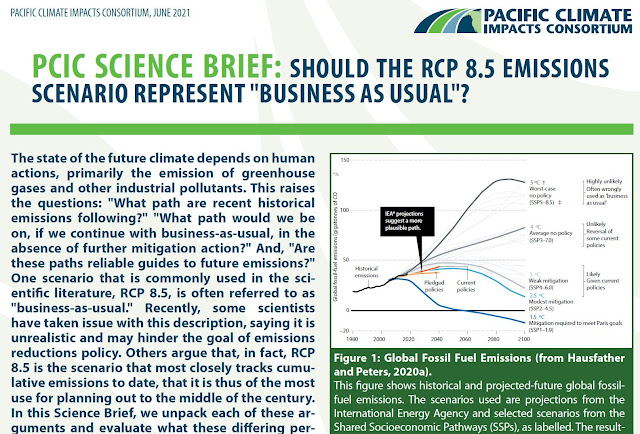

The Science Brief notes "Given that RCP8.5 is not the most "likely" outcome of emissions following business-as-usual or stated policy intensions, its reasonable to refer to it as a high emissions scenario instead of business-as-usual.

Others have also questioned the validity of RCP8.5 as Roger Pielke Jr. reported in Forbes (https://www.forbes.com/sites/rogerpielke/2019/09/26/its-time-to-get-real-about-the-extreme-scenario-used-to-generate-climate-porn/?sh=23797f704af0) and with Justin Ritchie in Issues in Science and Technology (https://issues.org/climate-change-scenarios-lost-touch-reality-pielke-ritchie/).

Why is understanding emissions scenario relevant to rainfall design intensities? Because temperature-based adjustments are recommended to project future rainfall design intensities (see Climatedata.ca and CSA IDF Guide approach in an upcoming post), and temperature changes depend on the emissions scenario considered. High emissions scenarios can be considered in future projections "if rainfall consequences to infrastructure are severe" as part of risk-based decisions making, according to Climatedata.ca. The ASCE's MOP 140 Climate-Resilient Infrastructure: Adaptive Design and Risk Management, in particular Chapter 7 Adaptive Design and Risk Management, also provides recommended levels of climate analysis as a function of design life and risk category, and the characteristics of various levels of climate analysis.

Adjusting IDF Curves to Account for Climate Change

The following page "IDF Curves and Climate Change" is presented at climatedata.ca and describes a methodology for adjusting rainfall design intensities for future conditions. The need to account for future conditions in long-term planning is noted in Environment and Climate Change Canada's Engineering Climate Datasets IDF Files:


Past changes in IDF values have been reviewed in a previous post: https://www.cityfloodmap.com/2020/07/how-have-rainfall-intensities-changed.html

Note that the ECCC guidance relies on RCP4.5 and RCP8.5 scenarios based on historical and future annual average temperatures for IDF stations from the Climate Atlas. Recent research by Roger Pielke Jr, Matthew G. Burgess and Justin Ritchie suggests those RCPs are not the most plausible scenarios (see: "Plausible 2005-2050 emissions scenarios project between 2 and 3 degrees C of warming by 2100" in Environmental Research Letters - https://iopscience.iop.org/article/10.1088/1748-9326/ac4ebf). Accordingly practitioners involved in robust risk assessments should consider how scenarios that are less plausible are considered in analysis.

****

Learning Zone
Topic 6: Intensity-Duration-Frequency (IDF) Curves
IDF Curves and Climate Change

It is not appropriate to use IDF curves based on historical information alone for long-term planning. To account for climate change impacts to extreme rainfall, ECCC recommends use of a scaling methodology to adjust IDF curves. Read this article for additional information about integrating climate change into IDF curves, including a practical example.

TIME TO COMPLETION
5 min

Summary

IDF curves are an important tool for decision-making about risks of extreme precipitation, but climate change is expected to increase extreme rainfall in Canada. Because of this, IDF curves based on historical observations alone are not appropriate for long-term decision-making. To account for climate change impacts to extreme rainfall and IDF curves, Environment and Climate Change Canada recommends use of a scaling methodology.

Climate change has intensified extreme rainfall events in North America and is projected to do so even further in future. However, projecting future rainfall metrics shown on IDF figures remains challenging due to sparse extreme rainfall observations, challenges in modelling local extreme rain events, and climate variability.

Due to the challenges described in the Primer on Climate Change and Extreme Precipitation, both climate models and statistical tools have limitations in their ability to project future short duration rainfall events. This is described in more detail in CSA PLUS 4013:2019: Technical Guide: Development, Interpretation And Use Of Rainfall Intensity-Duration-Frequency (IDF) Information along with corresponding guidance for practitioners.

However, a relationship between warming temperatures and precipitation extremes provides an alternate means for adjusting historical IDF curves. This ‘temperature scaling’ method is being increasingly used to estimate future Canadian rainfall extremes.  It is described in CSA PLUS 4013 and is being used to develop future rainfall estimates for the National Building Code of Canada and Canadian Highway Bridge Design Code.

Temperature scaling provides a simple and robust way to update IDF curves for climate change.  However, careful consideration of uncertainties in estimates of future extreme rainfall is still required.  Scaling factors may vary between locations and rainfall event types.  Local temperature change projections depend on future emissions, climate model choices, and natural variability.   And the historical IDF curves that underlie any future IDF curves estimates may themselves be less than ideal estimates of past rainfall extremes.

ECCC suggests the following method for estimating future changes to extreme rainfall magnitudes described on IDF curves:

    1. For the location of interest, download historical IDF curve data from ClimateData.ca or develop based on guidance from ECCC and CSA PLUS 4013:2019.  Use this data to determine historical estimated rainfall intensity (RC) for the storm duration and return period of interest.


    2. Determine an appropriate future timeframe and emissions scenario, and using ClimateData.ca, the Climate Atlas of Canada, or Climate Resilient Buildings and Core Public Infrastructure data, find the long-term (30-year mean) annual mean temperature change (ΔT) for your location, timeframe and emission scenario.  Develop this information by using results from an ensemble of climate models.

    3. Determine future estimated rainfall intensity value (RP) according to the equation:

RP = RC x 1.07^ΔT

Integrating Climate Change into IDFs: A Worked Example

This exercise provides an illustrative step-by-step example of how to apply the temperature scaling approach to shift IDF values and estimate future extreme rainfall conditions.

Example goal: Estimate change in intensity of 1-in-100-year rainfall, for a 1-hour storm duration, for design of new a Canadian infrastructure project that is expected to last 50 years.

  1. Estimate observed 1-in-100-year rainfall intensity for a 1-hour storm event.
  2. Estimate change in temperature, 50 years in the future.
  3. Estimate change in extreme rainfall 50 years in the future.

Step 1: Obtain a historical estimate of 1-in-100-year rainfall for 1-hour storms:

Download available ECCC IDF historical baseline information from ClimateData.ca -> Navigate to the ClimateData.ca IDF map, and identify the closest available data to your location, with a long record of rainfall observations.

Identify historical 1-in-100-year 1-hour storm intensity for your location.

Step 2: Estimate change in temperature for your location, for 50 years in the future:

Download historical and future annual average temperatures for the IDF station location from the Climate Atlas (or another suitable resource) for an ensemble of climate models and for RCP4.5 and RCP8.5.  If using the Climate Atlas: obtain a location-relevant climate summary report, and for Variable=‘Mean Temperature’ and Type of display=‘Time Series’, from the ‘Climate model data’ link obtain two CSV format spreadsheets, each containing multi-model RCP 4.5 and RCP 8.5 projection information.

  • For each climate model simulation and RCP scenario within the downloaded ensemble, calculate:
    • 31-year average Historical Temperature that best represents the observational period used to develop historical IDF information:
      • For each RCP scenario-specific CSV file, use a spreadsheet program to determine a 31-year average annual historical temperature for each climate model. Center this 31-year time period in the middle of the observational period used to develop the original historical IDF curves.
    • 31-year average Future Temperature, centered on the final year of the proposed asset lifetime:
      • For each RCP scenario-specific CSV file, use a spreadsheet program to determine the 31-year 2065-2085 average annual future temperature value for each climate model.   This period is used because it brackets the year 2070, which is the estimated end-of-life for the proposed asset, given the 2020 construction year, and a 50 year design lifetime.
    • Change in temperatures over the asset lifetime:
      • For each climate model and RCP scenario, use Microsoft Excel or a similar program to calculate the change in temperatures:
Temperature Change = Future Temperature – Historical Temperature

Step 3: Estimate change in extreme rainfall for your location, for 50 years in the future:

  • Given historical rainfall intensity and the range of climate model and RCP scenario-specific temperature change values, use temperature scaling to calculate range of estimated future 1-in-100-year 1-hour intensities for your location.  For each climate model and RCP scenario, use a spreadsheet program to calculate future 1 hour 1-in-100-year rainfall intensities RP using the equation  (RP=RC x 1.07^ΔT)  and setting RC to the historical rainfall intensity from the historical IDF curve, and ΔT equal to each climate model’s temperature change value, for each RCP scenario.
  • Aggregate future rainfall intensities into summary statistics for use in risk-based decision-making.  For each RCP scenario, calculate summary estimates of future rainfall intensity (for example, 10th, 50th and 90th percentiles).
  • Apply risk-based decision-making to choose the future extreme rainfall value that is most appropriate for asset risk thresholds.  For example, if rainfall consequences to infrastructure are severe, consider applying upper end of projected future RCP 8.5 1-hour 1-in-100-year rainfall intensities to infrastructure design.
Now that you have read IDF Curves and Climate Change, you may wish to review IDF Curves 101 and Best Practices on Using IDF Curves.


Design Rainfall Trends in Canada - Extremes not Trending with Means - Time to Check Theories on Shifting Rainfall IDF Statistics

Previous posts have reviewed changes in design rainfall intensities, that is, the statistics used to define IDF (intensity-duration-frequency) curves (https://www.cityfloodmap.com/2020/07/how-have-rainfall-intensities-changed.html).  These rainfall characteristics are the most commonly applied data in urban storm drainage system design, and are often directly related to the peak runoff rates accommodated in flow conveyance infrastructure systems.  These data are also used to derive hyetographs, temporal rainfall "storm" patterns or event time series, used in hydrologic analysis of urban collection systems (i.e., storm, partially-separated sanitary or combined), as well as urban and rural catchments. 

The most recent update of Canadian climate station data includes "IDF Files" in the Engineering Climate Datasets.  Probability distributions are fit to the observed annual maximum intensities to estimate design intensities at various 'return periods', i.e., event probabilities.  Low return periods characterize frequent events, such as 2-year storms that have a 1/2 or 50% annual exceedance probability.  Meanwhile high return period characterize rare events, such as 100-year storms that only have a 1/100 or 1% probability.

The most recent update to Environment and Climate Change Canada's IDF Files adds 8.7 years, on average, to climate station records that exist in both the earlier V2.00 and the newest V3.10 sets - here is a link to those IDF Files: https://climate.weather.gc.ca/prods_servs/engineering_e.html.  As the V2.00 data had a 29.1 year average record length, the longer V3.10 records with an average of 37.8 years of data are 23% longer.  This improves the reliability of the derived statistics, allowing higher return period event intensities to be estimated.  A rule of thumb is that return periods that are double the record length can be reliably estimated - so 38 years of data can be used to estimate 76 year return period intensities with good confidence.

The following chart illustrates the change in median design rainfall intensity from the earlier V2.00 to the most recently updated V3.10 datasets. 

Climate Change Canada Extreme Rainfall Trends
Design Rainfall IDF Trends Canada - Environment and Climate Change Canada IDF Files / Engineering Climate Datasets

Small frequent rain intensities, the 2 year rates observed in an average year, and represented by the green markets, have increased by almost up to 1% as a result of the longer records being added.  The less frequent 5 year and 10 year intensities, represented by purple and blue markers respectively, are generally unchanged overall.   The rare 50 and 100 year intensities, represented by the orange and red markers, have decreased the most, although the absolute change is limited.

The following table shows the % change in intensities from V2.00 to V3.10. 

Extreme rainfall intensity shifts in Canada
Rainfall intensity changes in Canada at long-term stations (median IDF curve intensity trends) .. note '20 Year' should be '25 Year'

The percentage changes are small when new data is added. When one compares the newest data added to the earlier V2.00 data a larger percentage change is apparent.  The following graphic illustrates this where the initial series, similar to the V2.00 data, is represented by the blue markers and the whole current series is represented by the orange markers.  While the average of the whole data series, represented by the orange dashed line, is only slightly above the initial series average (blue dashed line), the new data average is significantly higher (green dashed line). 
Rain intensity shifts in Canada with new data
Shifts in rainfall statistics with new longer periods of record (observations)

When the percentage changes in the above table are factored to account for the the changes in the new data relative to the initial series, the percentages increase by 4.3 times more, as shown in the table below. 

Rainfall intensity shifts in Canada - recent observations and effects on design intensities for frequent and rare events
Rainfall intensity shifts in Canada - new observation comparison with earlier Environment and Climate Change Canada Engineering Climate Datasets

While individual stations will vary, the above table shows that on average the rare 50 to 100 year rainfall intensities in the almost 9 years of new data, added between the V2.00 and V3.10 datasets, are 2.4% to 2.2% lower than the earlier V2.00 values.  These changes are over 4 times greater than the shift in V2.00 to V3.10 values. In contrast the 2 year intensities are 2.6% higher in the new data relative to the V2.00 data.   Again this is over 4 times the V2.00 to V3.10 shift in the previous table.

As the confidence interval for rainfall statistics is wide relative to these changes, they may not represent statistically significant changes in rainfall intensity.  Some change may be significant however.  For example, the Toronto City confidence limits are shown below.


The 95% confidence interval for the 5 minute 100 year intensity of 42.9 mm/hr is plus or minus 16% of the expected value of 261 mm/hr.  A decrease of 6.8% in that statistic (the decrease in 5 minute 100 year intensities in new vs. V2.00 data) could be statistically significant.

To evaluate significance of trends, the Engineering Climate Datasets have included trends on annual maximum series observations since the V2.30 datasets.  These are explored for the entire V2.30, V3.00 and V3.10 datasets in this post: https://www.cityfloodmap.com/2020/05/annual-maximum-rainfall-trends-in.html


Above and below are summaries of these trends.

Trend in Maximum Rain     v3.10        v3.00         v2.30
Significant Increase                 4.28%       4.18%        4.09%
Significant Decrease                2.24%      2.33%        2.30%
No Significant Trend             85.80%     85.55%      86.37%
No Calculation                         7.68%      7.94%        7.24%

Trends at long-term stations in Canada are shown in this post: https://www.cityfloodmap.com/2020/06/yes-were-getting-more-extreme-rainfall.html

An example of these trends is shown below for Alberta.


These annual maximum series (called AMS) trends are taken from summaries in Environment and Climate Change Canada's IDF Files, 'tucked away' text files called "idf_v-3.10_2020_03_27_trends.txt", and that look like this:


The AMS trends described in the text file above are also shown graphically on charts for each station and can be used to check if AMS trends may be significant.  We can look at an example to see if a large change in IDF values has an underlying significant change in AMS used to derive IDF values.

A summary of changes over time at the Toronto City climate station for 5 minute durations is shown below. The Toronto 5 minute 100 year design intensities have decreased from 268.5 mm/hr in the V2.00 period to 2007 to 261.0 mm/hr in the V3.10 (and V3.00) period up 2017.   That is a decrease of 2.8% since 2007.  


This appears to be a large change. But is the underlying AMS observed data change significant?  The AMS trend chart for Toronto City is shown below and shows that the 5 minute trend in the top right chart is decreasing but the trend is not significant.  Significant trends are illustrated with a blue trend line.


The 12 hour trends in the middle chart on the bottom is a significant trend in the AMS of observed rainfall though.  How have the IDF values over a 12 hour duration changed at the Toronto City Station? Does this significant trend in AMS result in a large change in derived IDF values for that duration?  The following table shows trends in IDF values for 12 hour durations from recent Engineering Climate Datasets.


Surprise !

Despite the 2 year frequent storm intensity decreasing for 1990 to 2017, the IDF value from 2007 to 2017 does not change - it does not decrease in step with the AMS trend that is significantly decreasing.

Why?

This has to do with the effect of the extreme 2013 event on the Gumbel probability distribution used to derive IDF intensities from the AMS series.  The standard deviation of the 12 hour AMS was only 13.8 mm up to 2007 and this increased to 14.8 mm up to 2017.  This extends the tails of the distribution, resulting in the increased 100 year 12 hour design intensity from 7.2 to 7.5 mm/hr.  

What about other durations and the decreasing 5 minute intensities in the earlier table? What is the effect of 2013 on other durations?

The extreme 2013 event increases the 100 year 24 hour design intensity, but the frequent 2 year 24 hour intensity has decreased since 1990, and has stayed steady since 2003, as shown below.


As for the short-duration design intensities that govern urban drainage / conveyance system design and performance, those are decreasing overall since 1990, despite some increases from 2007 to 2017 in the 1 hour data. 


Most infrastructure in the Toronto area was built by 1990, considering that almost 90% of buildings were already in place by 1991.  Therefore most infrastructure was designed considering rainfall data that was available before 1990.  The performance of that infrastructure during short duration rainfall events would be affected by the design assumptions and the likely limited rainfall data available at the time.  It would also be affected by land use changes that have been significant over pervious decades as explored in previous posts like this https://www.cityfloodmap.com/2020/10/town-of-oakville-class-action-lawsuit.html or this https://www.cityfloodmap.com/2016/08/land-use-change-drives-urban-flood-risk.html.

In examining the Toronto IDF trends it is worth thinking about a common assumption that changes in mean values are reflected in changes in extremes.  The 12 hour and 24 hour data show that decreases in 2 year values can be accompanied by increases in 100 year values - a change in the opposite direction.  The data across Canada in the very first table above show a reversed trend - while 2 year intensities have increased overall and for all durations, the 20, 50 and 100 year intensities have all decreased overall and for all durations with one single exception (15 minute 100 year intensities increased).  A presentation on the Institute for Catastrophic Loss Reduction's report Telling the Weather Story for the Insurance Bureau of Canada (IBC) is on the IBC YouTube channel (https://www.youtube.com/watch?v=aRppaOquP5E), and makes the assumption that changes to averages also affect the extremes.  This graphic is used to explain how a shift in probability distribution (1 standard deviation in this illustration) is supposed to effect the extreme probabilities (see 13:10 into the presentation):


The speaker indicates "if we shift the means, we necessarily shift the frequency of occurrence of those extreme events".  That theory, or "necessity", is not showing up in the IDF shifts in Canadian data however.  In fact the shift in means, represented by the 2 year rainfall intensities, are going up overall, but this is accompanied by a decrease in the extremes (20, 50 and 100 year rainfall intensities) overall.  The shifts in means and extreme are not in the same direction.  And we see examples of the opposite occurring too - Toronto 2 year intensities decreasing with 100 year intensities increasing for some durations.

Its always good to check theories with data.

Warming in Canada is assumed to bring more intense rainfall in theory, but data has not shown an increase as illustrated above with the Engineering Climate Datasets.  Shifts in means or averages "necessarily" shift extremes too, again in theory, but not in Canadian rainfall observations, again as shown above.  Shifts in daily rainfall, often simulated in climate models, are assumed to predict changes in short duration extremes affecting urban flooding as well - but Canadian data shows that in regions across the country the shifts in daily rainfall can be opposite to the shifts in short duration rainfall (see this post that drills down into IDF shifts in several regions of the country and there 24 hour intensities and short duration ones are going in opposite directions: https://www.cityfloodmap.com/2020/07/can-we-use-daily-rainfall-models-to.html).

Theories need to be tested with experiments, i.e., real observational data, of course.  Richard Feynman perhaps said it best: "It doesn't matter how beautiful your theory is, it doesn't matter how smart you are. If it doesn't agree with experiment, it's wrong."

Can We Use Daily Rainfall Models To Predict Short Duration Trends? Not Always - Observed Daily and Short Duration Trends Can Diverge

One can assess trends in rainfall intensities over various durations and return periods using Environment Canada's Engineering Climate Datasets.  National trends based on updating 226 station IDF curves were shown in an earlier post.

What are the trends in regions of Canada that have experienced significant flooding in the past?  And do the trends projected by models for long durations (1 day precipitation) match observed data trends?  No - some 24-hour trends are decreasing despite models estimating they will go up (or have gone up because of increasing temperatures).

Also, what is happening with observed short duration intensities, the ones responsible for flooding in urban areas, compared to the observed 1-day trends?

The data show short duration and long duration trends diverge. Therefore relying on models of 1 day precipitation to estimate what is happening with short duration, sudden, extreme rainfall should be done with caution.

A couple charts help illustrate these observed data trends and show what is wrong with relying directly on models to project local extreme rainfall.

This is the trend in observed rainfall for southern Ontario climate stations, using median changes in IDF statistics:

Southern Ontario Extreme Rainfall Trends

Long duration intensities are decreasing and short duration intensities are decreasing even more.  The extreme intensities (red dots = 100 year, orange dots = 50 year) decrease more than the small frequent storm intensities (green dots = 2 year).  Observed data diverges from Environment Canada models that suggest intensities are going up due to a warmer climate (see recent CBC article).

These are the trends for Alberta observed rainfall when new data are added and are reflected in the most current v3.10 datasets:

Alberta Extreme Rainfall Trends

In Alberta, long duration intensities decrease significantly (100 year is down by 4% on average).  Meanwhile the short duration intensities increase.  The long duration decrease is contrary to Environment Canada's simulation models that estimate 1 day rainfall at a sub-continental scale.

In northern Ontario, trends are different than in southern Ontario as shown below:

Northern Ontario Extreme Rainfall Trends

In northern Ontario the long duration intensities have increased but short duration intensities have decreased on average.  So we see short and long duration rainfall trends are diverging when we consider new data.

Climate modellers may suggest that simulated 1 day precipitation can guide what happens during short durations too.  Observed data suggest otherwise.  Trends actually diverge.

In brief, for this sample of regions shown above, we see these trends:

Location                 Short Duration Trend         Long Duration Trend

Southern Ontario      Larger Decrease                        Decrease
Northern Ontario            Decrease                              Increase
Alberta                            Increase                               Decrease

Remember "All models are wrong, some are useful".  Climate models do not accurately project changes in extreme rainfall in Canada based on observed data.  Furthermore, simulated 1 day precipitation trends from models cannot be used to assume short duration trends related to flooding in urban areas - short and long duration rainfall trends are observed to change in opposite directions in sample regions across Canada.

When using 1 day rainfall trends to estimate short duration trends, given the actual observed data trends above, it may be appropriate to conduct sensitivity analysis on potential shorter duration trends, especially if those shorter durations influence system behaviour (e.g., 'flashy' urban drainage systems).  Those short duration trends trends may be in an opposite direction or magnitude than the 1 day trends. For example, in Northern Ontario the 1 day 100-year intensities have increased 2% as a result of the most recent IDF data updates, however the intensities for durations of 2 hours or less have mostly decreased.

The following chart compares the 30 minute, 1 hour and 2 hour 100-year intensity trends with the 24 hour 100-year trends at 226 climate stations across Canada.


The correlation of short duration trends with 24 hour trends is weak with R-squared value of 0.12 for 2 hour trends, 0.06 for 1 hour trends and 0.006 for 30 minute trends.  This suggests that short duration trends are not correlated with 24 hour trends.   

***

Given recent flooding in British Columbia, it is worthwhile looking at trends in design rainfall intensities in BC. This chart shows that extreme rainfall intensities (red dots with 100-year return period, orange dots with 50-year return period) have not increased for most durations - the 12 hour duration intensities are up slightly on average (less than 0.5% increase), while other duration intensities have decreased by more than 2 % on average (5-minute 100-year intensities).


For the longest duration of 24 hours, intensities have decreased on average - typical 2-year intensities are unchanged on average while the moderate and extreme intensities (5-years, 10-year, 25-year, 50-year and 100-year) have decreased on average.

The following tables shows trends in observed annual maximum rainfall over various durations at BC climate stations with long-term records. These are called the Annual Maximum Series (AMS). Trends in derived design rainfall intensities above (e.g., 2-year to 100-year rainfall rates) follow these trends in AMS.


How Have Rainfall Intensities Changed in Canada Over the Past 10 Year? Not Much. Extreme 100-Year Rainfall and Short Duration Intensities Causing Flooding Are Lower

Environment and Climate Change Canada's Engineering Climate Datasets including rainfall intensity duration frequency (IDF) statistics are regularly updated as observation records become longer, and more and more stations have sufficient data to analyze.

What do the recent updates show? There is no new normal in design rainfall intensities.  Over the past 10 years, the severity of extreme rainfall has decreased on average.

Short duration sudden rainfall rates responsible for flooding in urban areas have also decreased overall - only the frequent, low intensities show an overall increase, which can be expected given additional precipitation in Canada. Of course some regions may have different trends (a previous post has shown that the southern Ontario frequent intensities (i.e., 2-year return period) have decreased).

Where do design intensities, the statistics in IDF curves and tables, come from?

Annual maximum series (AMS) of recorded rain intensity are collected for duration intervals of 5 minutes to 24 hours.  These series are used to derive probability density functions to describe the frequency distribution of rainfall, and that can be used to determine specific 'return period' design intensities.  The return period is the inverse of the probability of a rainfall intensity (or volume) over a certain duration occurring during a given year.  So a 100-year intensity has a 1/100 or 1% chance of being exceeded each year, while a 2-year intensity has a 1/2 = 50% chance per year. Storm sewers are designed to convey 2, 5 to 10-year return period rain intensities - 5-year is most common.  Flooding, especially extreme flooding, occurs at higher return periods becoming more severe above the 25-year return period and increasing for 50 and 100-year intensities.

The recent version 3.10 update to IDF statistics analyzes rainfall data up to 2017.  These intensities can be compared to the version 2.00 datasets that included data up to 2007.  A total of 226 stations were analyzed to check for changes in intensity - this total includes about 72 stations that have been relocated, but by not more than 5 km from their previous location.  The same trends are apparent for all the exact match stations (92 stations) and stations with new IDs but unchanged coordinates (154 stations).

The following chart shows the ratio of new intensities to old intensities for these 226 stations, so 1.0 means no change in design intensities.

Extreme Rainfall Trends in Canada - Design Intensities by Duration and Return Period

What are the take-aways?

1) rainfall design intensities are generally unchanged over the past 10 years, considering 3313 station-years of additional data,

2) extreme rainfall intensities, the 100-year rates (red markers in the chart), have decreased - the shortest duration intensity governing urban flood risk has dropped the most,

3) short duration intensities that govern sewver design, 5-year return period intensities (purple markers) over 5-minute to 2 hour durations are unchanged on average,

4) 2-year intensities (green markers), the low intensity rainfall that is exceeded in 50% of years, has increased slightly - these intensities do not govern infrastructure design and are unrelated to urban flash flooding or flood damages.

Popular media has focused on theoretical changes in rainfall intensity, sometimes confusing those projections with actual changes in rainfall intensity that have been measured or observed.  See this review of recent CBC coverage in the Financial Post.  Increasing damage amounts are erroneously linked to changes in rainfall due to a changing climate.

If popular media were to focus on observed data, and actual trends in extreme rainfall statistics, like the trends reviewed above, it would have to temper claims of a new normal in extreme weather.  Data do not show increases the critical rainfall intensities - in fact, on average, extreme intensities have decreased.

Changes in v2.00 to v3.10 dataset intensities are shown in the tables below.

Severe rainfall trends in Canada due to climate change
Extreme Rainfall Trends in Canada - Engineering Climate Datasets - IDF Curves


The analysis above is based on assessing the effect of adding additional data to the v2.00 IDF data intensities.  It is also possible to assess the effects of new data by splitting the series into old and new halves to compare IDF intensities and look for trends.  The following charts show the change in two long-period climate stations in the Toronto area.   Rainfall volumes are shown for a 24 hour period - intensities would be simply the volumes divided by 24 hours.

Toronto Pearson International Airport Climate Station - Changes in 24 Hour Rainfall Frequencies

For the Toronto Pearson International Airport climate station, the return periods of the old period volumes (blue line) have shifted right in the new data set, meaning longer return periods for a given volume, i.e., lower frequency.

The chart also compares how a climate model has predicted return periods have changed from 1961 to 2010, covering approximately a similar period.  Those model frequency shifts were reported by the CBC (link: https://www.cbc.ca/news/technology/extreme-rainfall-climate-change-1.5595396) and considered a 1 degree warming scenario. The climate model predicts lower return periods for a given volume, meaning that volume occurs more frequently - that is not consistent with observed local data at this station that has shown significantly longer return periods in the new period.

Toronto City Climate Station - Changes in 24 Hour Rainfall Frequencies

For the Toronto City (downtown) climate station, the return periods of the old period volumes (blue line) have shifted slightly right in the new data set, meaning slightly longer return periods for a given volume, i.e., slightly lower frequency.

The chart again compares climate model return periods for 1961 to 2010.  Again, the model, which represent a large area, and not necessarily the specifics of the Toronto area predicts lower return periods for a given volume, meaning that volume occurs more frequently - that is not consistent with observed local data at this station that has shown no significant change.

It is possible to look at the change in intensity as opposed to the change in frequency.  The following chart for Toronto Pearson International Airport climate station presents the same data but expresses the changes in terms of intensity, as opposed to frequency.

Toronto Pearson International Airport Climate Station - Changes in 24 Hour Rainfall Volumes
Often you can read in media reports that both the frequency and intensity increased over time - this is a peculiar way to express changes as that data can be used to show a change in one or the other but realistically not both at the same time.  To show the change in frequency and the change in intensity would mean allocating the change in some proportion to the two.

***

Do we have enough weather stations to analyze trends in observations - yes! - we are getting more and more stations and data over time - see previous post regarding additional Environment Canada stations since 1990.

In addition, municipalities are adding 100's of stations to support local studies as described in another post. More rain intensity data than ever before.

Although the data shows less extreme rainfall in Canada, some confuse models that predict future conditions and measured data.  The CBC misinterpreted a model predicting that 50 year storms would happen every 35 years in a time period out to 2015, and reported that this projections has already happened - read more about that here.