A research paper Assessment of non-stationary IDF curves under a changing climate: Case study of different climatic zones in Canada in the August 2021 Journal of Hydrology: Regional Studies by Silva et al. evaluated trends in historical annual maximum rainfall across Canada for a range of durations at climate stations with long-term records (over 50 years) (link: https://www.sciencedirect.com/science/article/pii/S2214581821000999). Projected future IDF curves are discussed in a future post.
Regarding observed rainfall maxima, the paper comments on the lack of consistent trends observed:
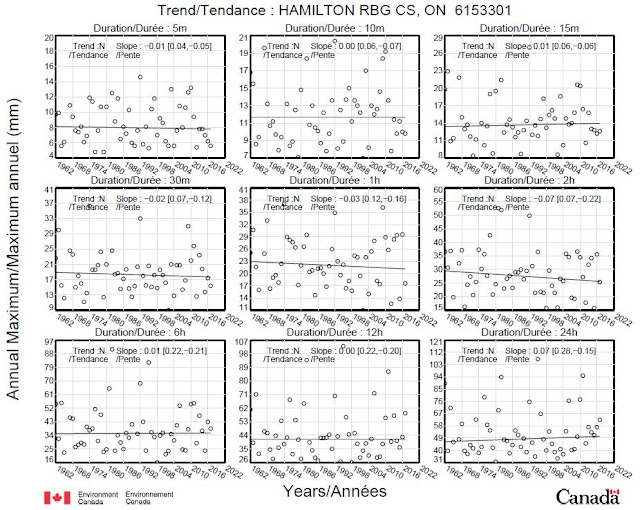
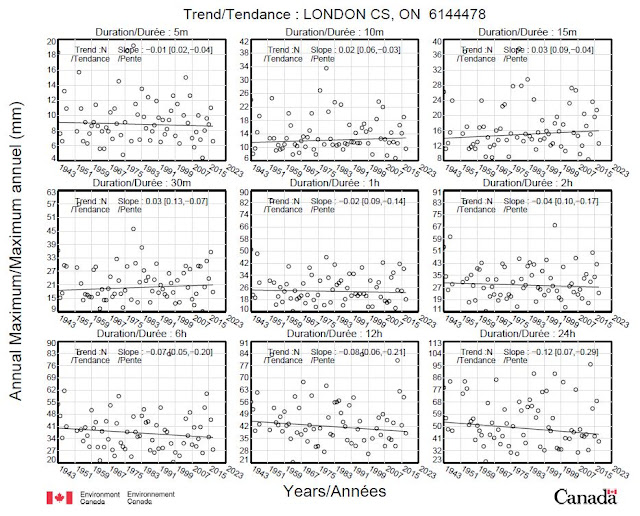
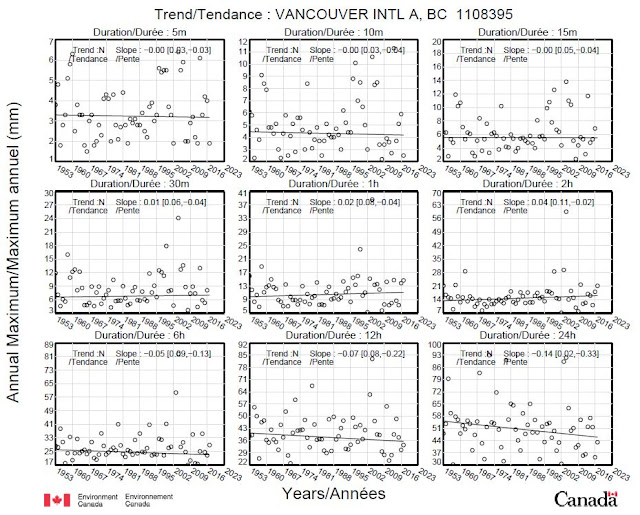
"There is no clear spatial pattern of trend in precipitation among the considered regions of Canada. Only the Moncton station shows a significant non-stationary behaviour in GEV modelling over most of the durations. No change pattern (i.e., trend detection) is confirmed for all durations at two sites under the influence of Great Lakes (London and Hamilton)."
The following Table 2 excerpt from the paper shows where annual maximum precipitation is stationary (not changing, as noted with the symbol "I") and non-stationary (changing) over the observation period.
Table 2. The best GEV model for each station and different durations in the historical period*.
| Duration (minutes) | Selected Station | |||||
|---|---|---|---|---|---|---|
| Calgary | Hamilton | London | Moncton | Vancouver | Winnipeg | |
| 5 | I | I | I | I | I | I |
| 10 | VI (0.030) | I | I | I | I | II |
| 15 | I | I | I | VI (0.043) | I | I |
| 30 | I | I | I | V (0.030) | I | I |
| 60 | I | I | I | II (0.003) | I | I |
| 120 | I | I | I | VII (0.047) | I | I |
| 360 | I | I | I | II (0.041) | VII (0.011) | I |
| 720 | II (0.036) | I | I | II (0.016) | I | I |
| 1440 | I | I | I | II (0.002) | I | VII (0.025) |
The best GEV model is shown using I to IX, according to the list of models in Appendix A. I corresponds to the stationary model, while values from II to IX correspond to the non-stationary models.
In central Canada, 26 of 27 rainfall series of maximum rainfall over durations of 5 minutes to 24 hours for Hamilton, London and Winnipeg stations were stationary, i.e., unchanged. The Great Lakes region represented by London and Hamilton, where no change in annual extreme rainfall was observed, also includes several large urban centres.
A previous post evaluated Environment and Climate Change Canada annual maximum rainfall trends for 676 climate stations across Canada: https://www.cityfloodmap.com/2021/10/annual-maximum-rainfall-trends-in.html
There were few statistically significant trends, up or down, in the most recent v3.20 datasets, as noted in the following chart:
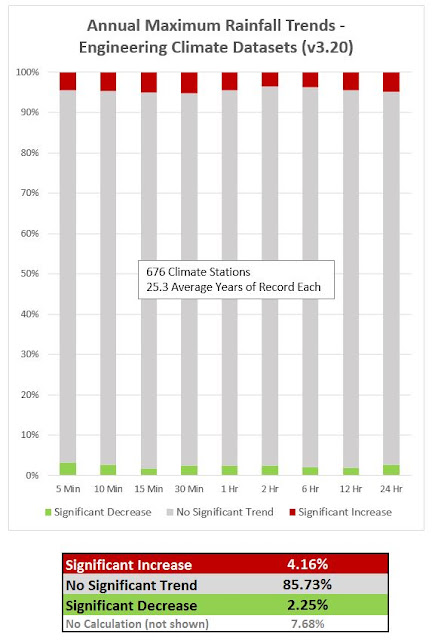
Trend in Maximum Rain v3.20 v3.10 v3.00 v2.30
Significant Increase 4.16% 4.28% 4.18% 4.09%
Significant Decrease 2.25% 2.24% 2.33% 2.30%
No Significant Trend 85.73% 85.80% 85.55% 86.37%
No Calculation 7.86% 7.68% 7.94% 7.24%
Significant Increase 4.16% 4.28% 4.18% 4.09%
Significant Decrease 2.25% 2.24% 2.33% 2.30%
No Significant Trend 85.73% 85.80% 85.55% 86.37%
No Calculation 7.86% 7.68% 7.94% 7.24%
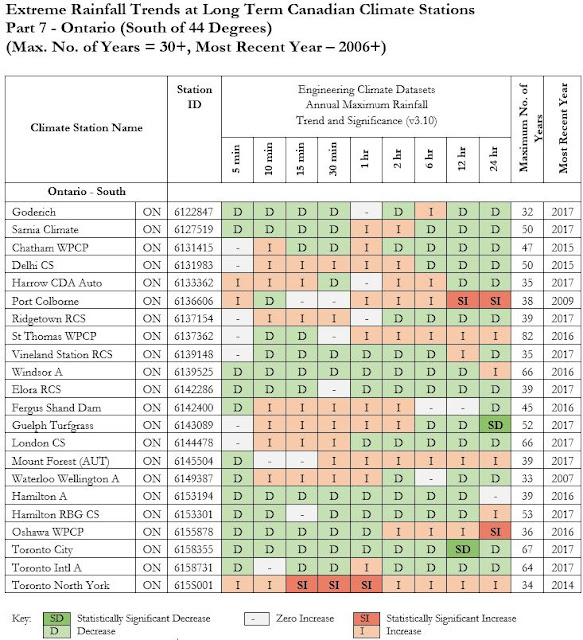
Looking at particular regions such as Southern Ontario and Manitoba where stationary annual maximum rainfall was observed in the paper above, one can see the variability in trends and significant across different stations and durations.
Southern Ontario, including the Hamilton and London stations has more decreasing trends than increasing ones:
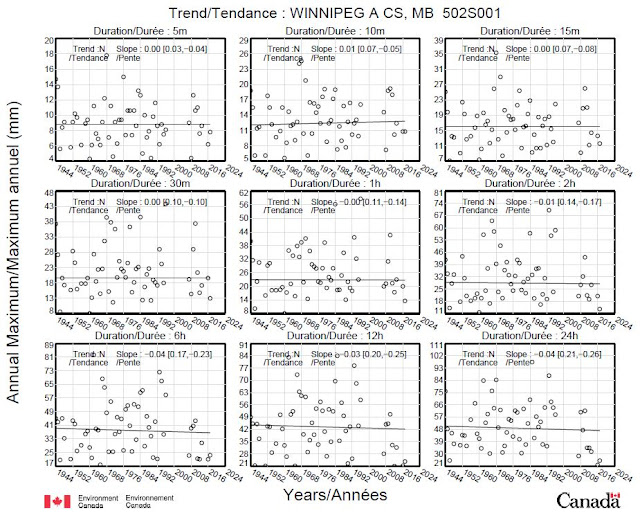
In Manitoba, the trends vary by station with some recording increases over all durations with other recording decreases. Winnipeg has a combination of decreases, no change, and an increase for the 9 durations evaluated as shown below:
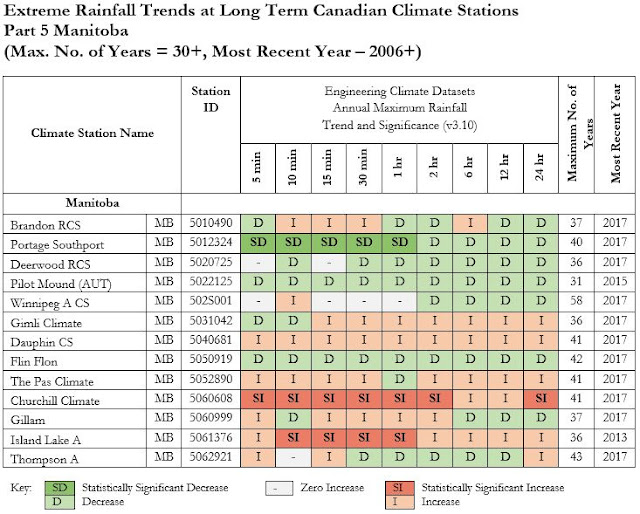
These trends are as reported in Environment Canada's v3.10 Engineering Climate datasets and will be published for all regions in the upcoming National Research Council of Canada cost benefit guideline for flood control infrastructure in a changing climate.
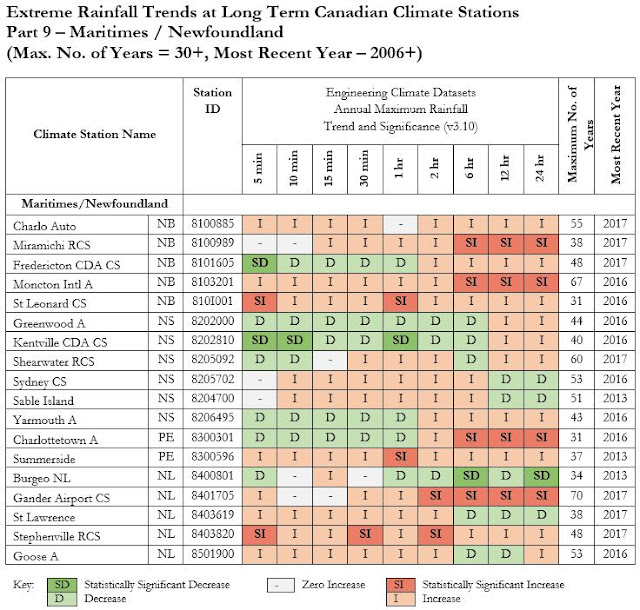
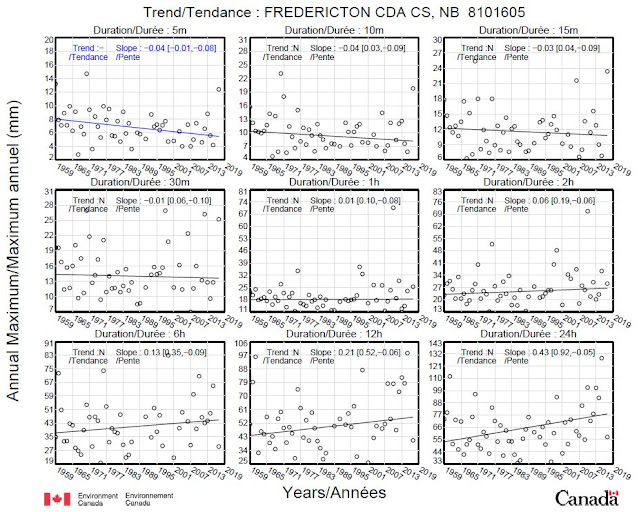
The tables above suggest that evaluating single stations may not provide a complete picture of overall changes in a region. For example, the paper highlights the non-stationarity in Moncton annual maximum rainfall. Other long term stations in New Brunswick, such as Fredericton have some trends that are opposite to those observed in Moncton (i.e., the Fredericton station has more decreasing trends than increasing ones and a statistically significant decrease), and others do not exhibit as strong increasing trends (e.g., the Charlo Auto station does not have the same number of statistically significant increases as Moncton and its 1-hour rainfall has not increased). Therefore Moncton is not representative of other long-term New Brunswick station trends.
The following charts show the v3.20 annual maximum series trends for the six stations studied in the paper, i.e., Calgary, Hamilton, London, Moncton, Vancouver and Winnipeg.

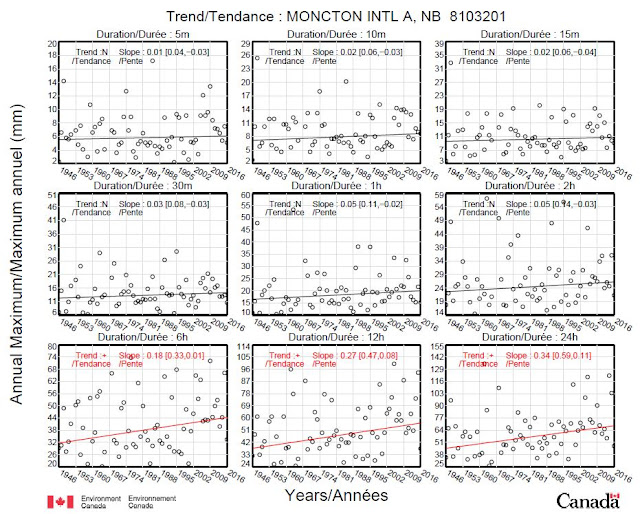
Only Moncton 6, 12 and 24-hour series have statistically significant increases. As noted above, Fredericton has observed decreasing trends as well, including a statistically significant decrease in 5-minute annual maximum rainfall, and no statistically significant increases:
Ultimately, annual maximum rainfall series are used to derive design rainfall intensities (IDF curves) by fitting a probability distribution to observed annual maxima. A previous post demonstrated how IDF values changed following the addition of recent observations (link: https://www.cityfloodmap.com/2020/07/how-have-rainfall-intensities-changed.html):
***
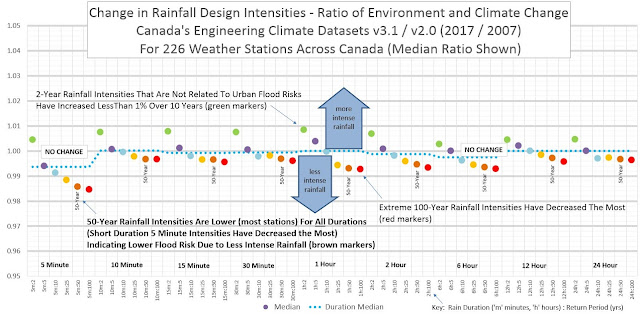
The paper also presents future rainfall intensity projections that will be reviewed in an upcoming post. A review of projected results, included in supplemental material but not the main document shows that under some emissions scenarios (i.e., representative concentration pathways), rainfall intensities are projected to decrease in Ontario. The main document only presents projections for a high emissions scenario (RCP8.5) that has been questioned in terms of its likelihood by the Pacific Climate Impacts Consortium (see Science Brief: https://www.pacificclimate.org/sites/default/files/publications/Science_Brief_39-June_2021-final.pdf)
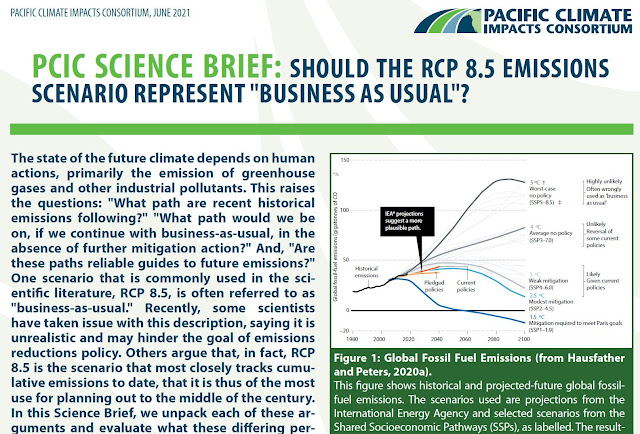
The Science Brief notes "Given that RCP8.5 is not the most "likely" outcome of emissions following business-as-usual or stated policy intensions, its reasonable to refer to it as a high emissions scenario instead of business-as-usual.
Others have also questioned the validity of RCP8.5 as Roger Pielke Jr. reported in Forbes (https://www.forbes.com/sites/rogerpielke/2019/09/26/its-time-to-get-real-about-the-extreme-scenario-used-to-generate-climate-porn/?sh=23797f704af0) and with Justin Ritchie in Issues in Science and Technology (https://issues.org/climate-change-scenarios-lost-touch-reality-pielke-ritchie/).
Why is understanding emissions scenario relevant to rainfall design intensities? Because temperature-based adjustments are recommended to project future rainfall design intensities (see Climatedata.ca and CSA IDF Guide approach in an upcoming post), and temperature changes depend on the emissions scenario considered. High emissions scenarios can be considered in future projections "if rainfall consequences to infrastructure are severe" as part of risk-based decisions making, according to Climatedata.ca. The ASCE's MOP 140 Climate-Resilient Infrastructure: Adaptive Design and Risk Management, in particular Chapter 7 Adaptive Design and Risk Management, also provides recommended levels of climate analysis as a function of design life and risk category, and the characteristics of various levels of climate analysis.


