Showing posts with label Munich RE. Show all posts

NRC National Guidelines on Flood Control Cost-Benefit Analysis Share Extensive Insurance Industry Loss Data Across Canada Define Flood Control Benefits

The National Research Council of Canada (NRC) has released the National Guidelines on Undertaking a Comprehensive Analysis of Benefits, Costs and Uncertainties of Storm Drainage and Flood Control Infrastructure in a Changing Climate.

The full guidelines are available here to download: https://nrc-publications.canada.ca/eng/view/object/?id=27058e87-e928-4151-8946-b9e08b44d8f7

These guidelines delve into many topics to support comprehensive benefit cost analysis. A previous post explored historical extreme rainfall trends related to flood damages (see post: https://www.cityfloodmap.com/2022/02/nrc-national-guidelines-on-flood.html). This post shares insurance industry loss data presented in the guidelines. Such data support the comprehensive assessment of direct and indirect flood losses that represent potential benefits of new and upgraded flood control infrastructure investments.

The NRC Guidelines identify two approaches for assessing flood damages for projects of various scale and detail including:

i) a bottom-up approach based on property-scale losses, and

ii) a top-down approach based on scalable national or regional insurance loss data.

Previously unavailable data was shared by several organizations including Munich Re, the Insurance Bureau of Canada, and CatIQ to support the analyses in the guidelines. Thank you!

CatIQ Property-Scale Flood Losses in Canada (Bottom-up Analysis)

Catastrophe Indices and Quantification Inc. (CatIQ) is a Toronto-based subsidiary of Zurich-based PERILS A.G. that delivers detailed analytical and meteorological information on Canadian natural and man-made catastrophes. Established in 2014, CatIQ and is supported by the majority of the Canadian insurance and reinsurance industry, allowing it to provide the most reliable source of catastrophe loss information in Canada. Data are available through CatIQ’s online subscription-based platform that includes comprehensive insured loss and exposure data used by the insurance industry and other stakeholders - we used this database to analyze regional and national flood and related water losses across Canada.

Records of flood and water loss and loss expenses analyzed were from January 2008 to January 2019 while records of sewer back-up/water losses analyzed were available from April 2013 to January 2019. 

As noted in the NRC Guidelines "Nationally, the average loss, representing closed claims is approximately $22,300 based on well over 70,000 claims – this average value is for 55 events. Due to many smaller events in the database, the median loss is lower than the average at $16,300". The following chart shows the distribution of losses across these 55 events (see Appendix D | Direct & Indirect Long Time Horizon Damages, Figure 8):

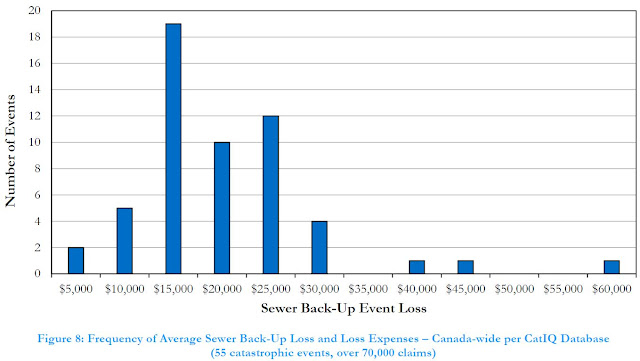
Given that CatIQ defines events and compiles loss data for those events with over $25M in losses, some small events with smaller losses. A review of CatIQ indicated that events with a higher number of claims, corresponding to more extreme and widespread events, reported higher average claims. 

CatIQ data shows regional differences in sewer-back losses as reported in the NRC Guidelines (Appendix D | Direct & Indirect Long Time Horizon Damages, Table 14):

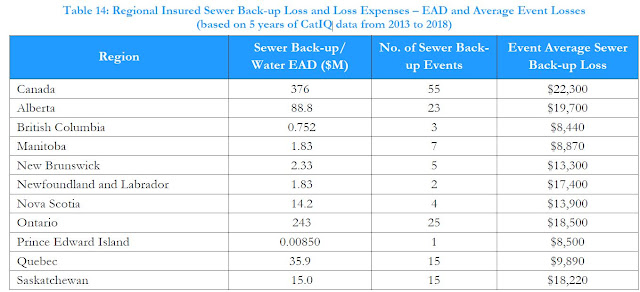
Intact Financial has recently noted that the often-cited average cost of $43,000 represents an upper limit for certain flood events (Intact Financial, 2019) - that makes sense for an extreme event, as reported in the NRC Guidelines:

"...an extreme event average claim approaching $40,000 could be appropriate. Specifically, the June 2013 Alberta flood event characterized by extensive riverine flooding had an average claim of over $37,000 for nearly 8000 sewer back-up/water claims."

The one instance of an event with average claims of up to $60,000 per policy represented only a handful of claims. Note that some have mistakenly cited the above $43,000 value as the average cost of a flooded basement across Canada, which is not supported by available data. It could be more reflective of overall losses in some regions, including both insured and uninsured losses. 

How can this data be used to assess benefits in cost benefit analysis? The NRC Guidelines presents a case study evaluating local sewer improvement alternatives using CatIQ data to assess benefits.  See Appendix I | Case Studies | Case Study 3 -  EXISTING STORM SEWER SYSTEM DAMAGE REDUCTION.

For another example, refer to the NRC Guidelines authors 2020 WEAO fall webinar paper that illustrates how regional sewer-back-up losses can be used to derive EAD values for project areas. That example applies where the number of flooded basements is available through detailed, local modelling. See post with paper:   https://www.cityfloodmap.com/2021/12/national-guideline-development-for.html.

More examples? Infrastructure Canada's Disaster Mitigation Adaptation Fund (DMAF) requires an assessment of Return on Investment (ROI) for candidate projects, specifying a minimum ratio of benefits to costs of 2:1. Local sewer back-up flood damages may be used to better define the potential benefits of infrastructure investments that reduce losses, following the approach in the WEAO fall webinar paper above. Depending on the level of service for a flood damage reduction project, a significant portion of expected damages many be avoided, and counted as benefits in a DMAF ROI calculation.

Munich Re Insured and Overall Losses (Top-Down Analysis)


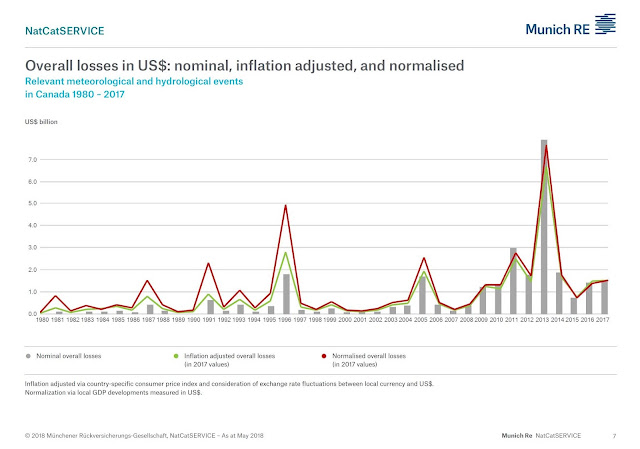
Munich Re
gratefully drilled down into previously-available North American loss data presented in its NatCatSERVICE and provided historical Canadian insured losses for hydrological and meteorological events, and estimated uninsured losses.

The NRC Guidelines present the following figure showing these historical losses for meteorological and hydrological ‘event families’ including meteorological events (tropical storms, extra-tropical storms, convective storms and local windstorms) and hydrological events (flood and mass movement)  (see Appendix D | Direct & Indirect Long Time Horizon Damages, Figure 5): 

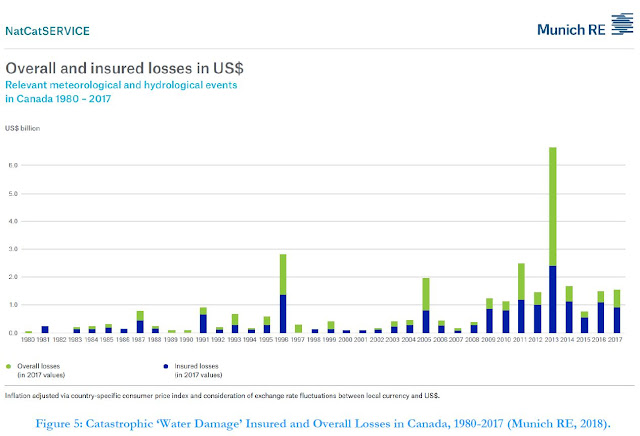
Munich Re data were then analyzed to derive return-period and Expected Annual Damages (EAD) across Canada. The analysis revealed 'average' 2-year losses of $426M and rare 100-year losses of $2.29B. The EAD was $697M for insured losses (the blue bars in the figure above), showing that expected losses that factor in occasional extreme losses is higher than the average.

Obviously such flood losses are significant and need to be managed. Expected annual insured losses of $695M represent about 0.4% of the Canadian GDP of $1.6T. 

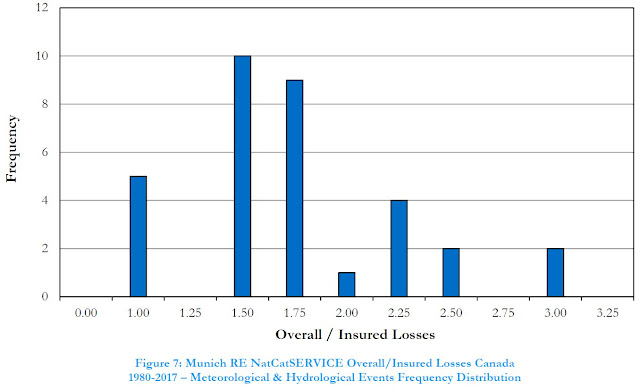
Overall losses that include uninsured losses are higher and are represented by the green bars in the chart above. Munich Re estimates this as described in NatCatSERVICE documentation and considers insurance market penetration and reported disaster assistance payouts. The following chart shows the relation between overall and insured losses (ratio of green to blue bars above)(see (see Appendix D | Direct & Indirect Long Time Horizon Damages, Figure 7):


The overall losses in an individual year could be 3 times the insured losses. On average from 1983 to 2017, overall losses were 1.94 times insured losses. Why is there variability? Well, different types of hazards in Canada have different levels of insurance coverage. Sewer back-up has a relatively high degree of coverage and in years dominated by severe urban flooding events (e.g., Toronto and GTA in 2005) there would be relatively lower uninsured losses. In contrast, riverine flood insurance is was previously not available for residential properties in Canada until about 2015, and may not be available for high risk non-residential properties in floodplains - so in 2013, Calgary riverine flooding would not have been insurable (although many companies may still have granted claims in that instance as a 'goodwill measure' as noted by KPMG in 2014).  

How can Munich RE loss data be used to assess benefits of adaptation to flooding and inform funding policies? The overall losses can guide us as to how much we should invest to reduce these damages. 

The NRC Guidelines include case studies that apply Munich RE loss data including (see Appendix I | Case Studies):

i) CASE STUDY 1 – NATIONAL-LEVEL POLICY DEVELOPMENT, and

ii) CASE STUDY 2 – MUNICIPALITY-LEVEL PROJECT PLANNING

Case Study 1 conclusions note broadly how insurance loss information may be used: "This case study demonstrates that high-level policy decisions may be sufficiently informed through available information sources for future benefits (using insurance industry data to guide the estimation of avoided future losses), and the setting of target economic performance (using a benefit-cost ratio approach or some other relevant measure of return on investment) to establish, in this case, appropriate funding levels for allocation."

In the Case Study 1 example analysis, based on a i) Munich RE overall (insured and uninsured) EAD value of $1.347B (2017 dollars) for water damage (hydrological and meteorological events), and ii) CatIQ EAD of $819 million (2018 dollars) for insured flood loss and loss expense, a representative EAD of $1.0B was considered. This values was used to estimate an annual funding allocation noting:

 "Accordingly, based on the parameters assumed in this analysis relating to the estimation of benefits, time value of money and acceptable benefit-cost ratio (return on investment), a national flood protection policy could allocate about $2.8 billion annually (in 2020 dollars) for a 10-year period on projects that would achieve the technical performance objectives sought."

Case Study 2 conclusions note how insurance loss data was applied at a municipal and project-scale assessment of damages and benefits: "This case study demonstrates the downscaling of broad-scale insurance industry loss data to more granular levels for application to a municipality-level program and further down to the level of a collection of projects within the municipality. This “top down” approach to estimating future benefits (avoided losses) negates the need for highly detailed “bottom-up” methods for urban drainage system damage and benefit estimation when such approaches might be impractical or require excessive efforts relative to the accuracy they might produce. That is, estimation of urban drainage system damages on a bottom-up (property scale) basis, considering minor and major storm system risk, wastewater system risk, system interactions, and property-scale grading and construction factors has not been shown to be feasible or correlated to reported damages."

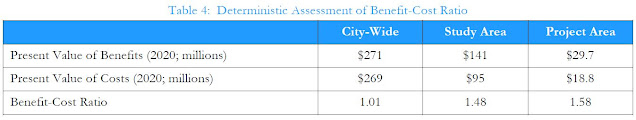
Munich RE loss data was used in Case Study 2, based on the City of Markham, Ontario to determine the following expected annual damages (and potential benefits of infrastructure investments):

• EAD for City-Wide Level Assessment: $13.2 million

• EAD for Assessment of Study Area: $5.1 million

• EAD for Assessment of Project Area: $0.8 million

The scaling of national Munich RE loss data and EAD considered proportion of population in Case Study 2. Regional loss data from IBC or CatIQ, excluding uninsured losses, could similarly be scaled. A review of proportion of GDP, as part of DMAF ROI assessments in Markham, indicated a similar proportion to population. The NRC Guidelines illustrate how several economic, demographic, built-form and infrastructure parameters are closely correlated across regions of Canada, and are related to regional expected losses. This is the basis of top-down loss scaling considered where bottom-up property scale analysis is impractical.

The following tables summarize the benefits (based on scaled Munich RE losses), costs (see a future post on costing data), and achieved benefit-cost ratios at a municipal, broad study area, and at a sub-project scale.


Normalized, Inflation and Growth Adjusted Losses for Hydrological Events Like Floods Show Peak Losses in 1990's - Meteorological Event Losses Peaked in 2005.

Flood losses in North America do not seem to be increasing when growth and inflation are considered. That's good news, suggesting newer development is more resilient.

Munich RE's NatCatSERVICE provides information on relevant and catastrophic losses. Insured and uninsured losses are tracked for various events including hydrological events (floods, flash floods, severe storms) and meteorological events (hurricanes, storm surges, floods). Charts showing trends in losses are available from 1980 to 2017 expressed in 2017 $USD including:
  • Nominal Overall Losses - values as they originally occurred
  • Inflation Adjusted Losses - accounting for changes in monetary equivalent
  • Normalized Losses - accounting for growth of values and assets (considering nominal gross domestic product)
Normalized Flood Losses Adjusted for GDP Growth Inflation Adjusted
Normalized Flood Losses - Relevant Hydrological Events in North America 1980-2017 per Munich RE NatCatSERVICE

Normalized Flood Losses Adjusted for GDP Growth Inflation Adjusted
Normalized Flood Losses - Catastrophic Hydrological Events in North America 1980-2017 per Munich RE NatCatSERVICE
The normalized, inflation-adjusted losses for hydrological events have peaked in 1990's, e.g., due to the Great Flood of 1993. How about considering the 2017 hurricanes experienced? The losses of Hurricane Harvey, Maria, and Irma are tracked as meteorological events as shown in the following charts:
Normalized Hurricane Losses Adjusted for GDP Growth
Normalized Flood Losses - Relevant Meteorological Events in North America 1980-2017 per Munich RE NatCatSERVICE
Normalized Hurricane Losses Adjusted for GDP Growth
Normalized Flood Losses - Catastrophic Meteorological Events in North America 1980-2017 per Munich RE NatCatSERVICE
Data shows that relevant and catastrophic losses peaked in 2005 due to Hurricane Katrina. Actual, unadjusted losses were higher in 2017 than in 2005, but when adjusted for inflation 2005 losses were near 2017 values - and when GDP growth is considered, 2005 values exceed 2017.

It is common for losses to be reported without adjustments. Making adjustments to normalize losses considering growth in net written premiums (i.e., higher losses are expected with growth in insurance market - more policies, more premiums, more payouts and claims). This was explored in my paper published earlier this year:


Where unadjusted losses, shown at right, suggest a significant increasing loss trend, adjusted losses, shown below, do not indicate a significant increasing trend.

Catastrophic Losses Adjusted for Net Written Premiums
Catastrophic Losses Adjusted for Growth in Net Written Premiums in Canada - per Robert Muir's Thinking Fast and Slow on Floods and Flow.
The Geneva Organization's recent report Understanding and Addressing Global Insurance Protection Gaps illustrates changes in uninsured losses as a share of Gross Domestic Product (GDP). As stated in the report: "Over the past three decades, the share of worldwide uninsured losses in global GDP
has decreased from 0.31 to 0.19 per cent. For high-income countries, the share fell from 0.20 to 0.13 per cent. Upper middle-income countries show a reduction from 0.21 to 0.11 per cent". The significant decreases appear small on the chart, due to the logarithmic scale on the y-axis.


***

More resources? The initial charts above were from reports prepared using the online NatCatSERVICE.

This is a link to the Munich RE NatCatSERVICE report on North American losses from hydrological events: Hydrological Losses North America 1980-2017

Similarly, this is a link to the report on those losses from meteorological events: Meteorological Losses North America 1980-2017

***
How about Canadian trends? The following NatCatSERVICE chart was provided by Munich RE specifically for Canada. It shows some increasing trends in losses after accounting for inflation just as the chart above with Canadian catastrophic losses normalized by growth in net written premiums. 

Canadian Flood Damage Trends Insurance Losses

Looking at data from the Insurance Bureau of Canada including loss data and net written premiums, we see both of these values increasing in recent decades as shown below.


The following charts show catastrophic losses vs net written premiums, and catastrophic waster losses vs net written premiums. To smooth out variability in annual losses, a 5-year moving average is used in the charts.


The chart above shows a plateau in water losses vs premiums for the 5-year ranges centred around 2003 to 2010. The 5-year ranges centred around 2011 to 2015 are substantially higher, reflecting the high water losses in 2013 due to the Alberta and Toronto-area floods. The r-squared values suggest a strong correlation between growth in premiums and growth in losses.

Other factors affect risks and losses. Urbanization is a key factor increasing runoff and risks and this has been documented in key case law in Ontario (see previous post with factors). That is, hydrologic stresses increase due to the expansion of urban areas and the intensification of development within urban areas. Other factors include hydraulic constraints in infrastructure systems that can degrade over time - these include natural factors such as blockages of sewer pipes due to build-up of calcite, sediment, roots, FOG (fats, oils, grease), or engineered modifications to collection systems that hold back wastewater flow during wet weather to prevent spills in watercourse - these modifications can in some cases aggravate back-up risks in the wastewater collection system.

Factors such as increasing rain intensity and frequency have been suggested by some however, Environment and Climate Change Canada data (see previous post on version 2.3 Engineering Climate Datasets, and new version 3.0 datasets), numerous regional studies (see compiled engineering and research reports), and the CBC Ombudsman findings (see January 2019 findings on extreme storm reporting), supported by Environment and Climate Change Canada data, all indicate no change in extreme rainfall.

***

Also see previous post - Catastrophic Losses in Canada - Have Flood Damages Increased Significantly Or Have Changing Data Sources Affected Trends?

***

The Government of Canada has found that the majority of loss increases have been due to growth, and climate change 'may' be having an effect - this is reiterated in the just-released Canada in a Changing Climate: National Issues Report (see post: https://www.cityfloodmap.com/2021/06/national-issues-report-identifies.html). Canadian loses have been normalized for growth show a moderate increase over time - the report notes that earlier data may be incomplete, which would affect the normalized trend.


Catastrophic Losses in Canada - Have Flood Damages Increased Significantly Or Have Changing Data Sources Affected Trends?

Disaster Losses Are Up
Catastrophic loss trends have been reported regularly in Canada, often in relation to flood damages. These have often linked to climate change effects as well as other factors that may include aging infrastructure (not a significant factor in our mind), or urbanization and intensification (the true overriding factor in many urban centres). This post looks at how trends have changed in relation to changes in data sources.

GDP Adjusted Losses are Down
A blog post by the Institute for Catastrophic Loss Reduction (ICLR) discusses loss trend reporting by the Insurance Bureau of Canada. ICLR discusses but dismisses the calls for adjusting losses for growth, which is commonplace in Munich RE NatCatSERVICE analysis and reporting, and which is promoted by may others (this includes my paper in the Journal of Water Management Modelling which evaluated losses adjusted for net written premiums, and Roger Pielke Jr.'s work, such as reported here in Five Thirty Eight - see charts to the right - that also calls for evaluating trends considering GDP growth).

The ICLR notes "Normalizing disaster loss data to include such factors as growth in population, economic activity and building stock is not a simple undertaking. Further, there are many problems with using simple measures like GDP or insurance premium growth as a normalizer. For these and other reasons, I don’t want to go ‘there’ at this point ...".

So ICLR is content to us the following chart that does not include GDP adjustments:

Catastrophic Losses Flood Damages Canada
Losses in Canada Unadjusted for GDP Growth - 1983-2007 Data per IBC Survey, 2008- Data per CatIQ.

The ICLR notes a change in the data source for the above graph: "Bureau data begins at 1983. From that year to 2007, IBC uses data it collected itself through various company surveys conducted immediately after significant natural disaster events. It also uses various data from Property Claim Services (PCS), Swiss Re, Munich Re and Deloitte. After 2007, the Bureau only uses data from Catastrophe Indices and Quantification Inc. (CatIQ)."

How does the change in data affect reported losses? We can look at how the increase in losses has been reported, for example by the ICLR in 2016:

Catastrophic Loss Trends in Canada. Effects of change in data source on reported losses pre 2008.
Below the ICLR chart, the timing of the change in data is shown. This indicates that the change in reported annual losses from $400M average up to 2008 to $1B average after corresponds to the change in data source in 2008.

More recently the Intact Centre on Climate Adaptation (ICCA) has reported trends in losses on TVO's The Agenda as shown in the chart below:

Intact Centre on Climate Adaptation cites changes in insurable claims on TVO (chart shown), with ICLR's noted change in data sources added below (IBC data up to 2007 and CatIQ data from 2008 onward).

Again, the change in data is added below the ICCA chart. The lower losses of $200-500M up to 2008 and higher losses typically over $1B from 2009 onward correspond to this change in data source.

Adjusting for data sources or for GDP does not really change priorities for flood risk and catastrophic loss reduction. Better characterization of the GDP-adjusted trend can give us insight into the effectiveness of past mitigation efforts, more-resilient design standards that are common in modern practice. Without such GDP adjustment, one would think that everything is built as disaster-prone as it was in the past. Also, understanding the cause of the trend in losses will help focus adaptation or mitigation efforts in the proper place - if increases are explained by GDP growth as opposed to changes in extreme weather (shown to not be a factor) efforts will be placed on adaptation infrastructure built to old, less-resilient design standards as opposed to mitigation (e.g., GHG reduction).

A more wordy comment has been added to the ICLR blog post.

***

A paper Trend Analysis of Normalized Insured Damage from Natural Disasters, published in:
Climatic Change, 113 (2), 2012, pp. 215-237, by Fabian Barthel and Eric Neumayer, Department of Geography and Environment and The Grantham Research Institute on Climate Change and the Environment, London School of Economics and Political Science explores "Normalized" / GDP adjusted damages, exploring trends for different types of events.

As noted in their abstract:

"As the world becomes wealthier over time, inflation-adjusted insured damages from natural disasters go up as well. This article analyzes whether there is still a significant upward trend once insured natural disaster loss has been normalized. By scaling up loss from past disasters, normalization adjusts for the fact that a hazard event of equal strength will typically cause more damage nowadays than in past years because of wealth accumulation over time. A trend analysis of normalized insured damage from natural disasters is not only of interest to the insurance industry, but can potentially be useful for attempts at detecting whether there has been an increase in the frequency and/or intensity of natural hazards, whether caused by natural climate variability or anthropogenic climate change."

The following charts from the paper show an increase in deflated (non-normalized) damage losses over time, and virtually no change in normalized losses.

Global deflated insured losses from natural disasters
Global normalised insured losses from all disasters
Similarly, the following charts illustrate normalized trends for convective storm events (4165 disasters) showing a decrease, all storms including winter and other storms but excluding tropical cyclones (4369 disasters) showing a decrease, and for tropical cyclones (874 disasters) showing an increase.

Global normalized insured losses from convective events
Global normalized insured losses from all storm events except tropical cyclones


Global normalized insured losses from tropical cyclones


***

The Government of Canada has reported that the majority of loss increases have been due to growth (more exposed people, assets and wealth), and that climate change 'may' be having an effect - this contrast many media and insurance industry comments. The true driver of increased losses was reiterated in the just-released Canada in a Changing Climate: National Issues Report (see post: https://www.cityfloodmap.com/2021/06/national-issues-report-identifies.html). Canadian loses have been normalized for growth and show a moderate increase over time - the report notes that earlier data may be incomplete, which would affect the normalized trend as well (more complete older data could decrease the trend).