Showing posts with label ASCE. Show all posts

Future Extreme Rainfall IDF Values in Canada Include Decreasing Intensities for Some Emissions Scenarios and Regions

 A research paper Assessment of non-stationary IDF curves under a changing climate: Case study of different climatic zones in Canada in the August 2021 Journal of Hydrology: Regional Studies by Silva et al. projected future IDF curves in several regions of Canada under various emissions scenarios (link: https://www.sciencedirect.com/science/article/pii/S2214581821000999)A previous post discussed historical annual maximum rainfall at climate stations with long-term records and noted stationary values for several stations and rainfall durations (i.e., no change in annual extreme rainfall observations) - see post: https://www.cityfloodmap.com/2021/12/has-extreme-rainfall-become-more-severe.html.

The paper presents changes in typical design intensities for:

i) 120-minute (2-hour) 5-year return period values (e.g., along with intensities for shorter durations, these data are used to design storm sewers in many jurisdictions), and

ii) 1440-minute (24-hour) 100-year return period values (e.g., used to design stormwater detention facilities, or used to derive design hyetographs for floodplain mapping in some watersheds and for RDII analysis in some wastewater collection networks prone to wet weather impacts, etc.).

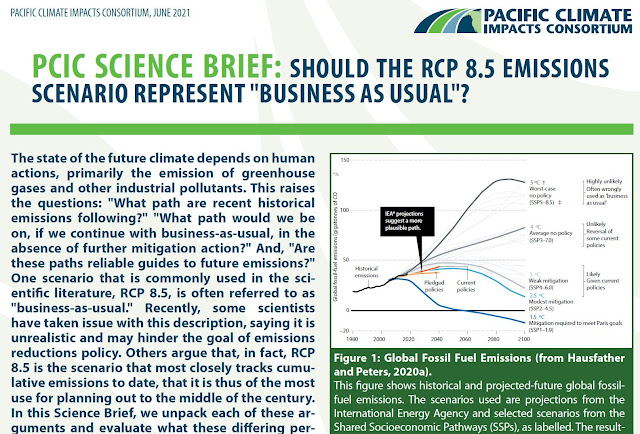
Future projections are made for the period 2020-2100. The main paper presents percentage changes for the RCP8.5 emissions scenario as follows:


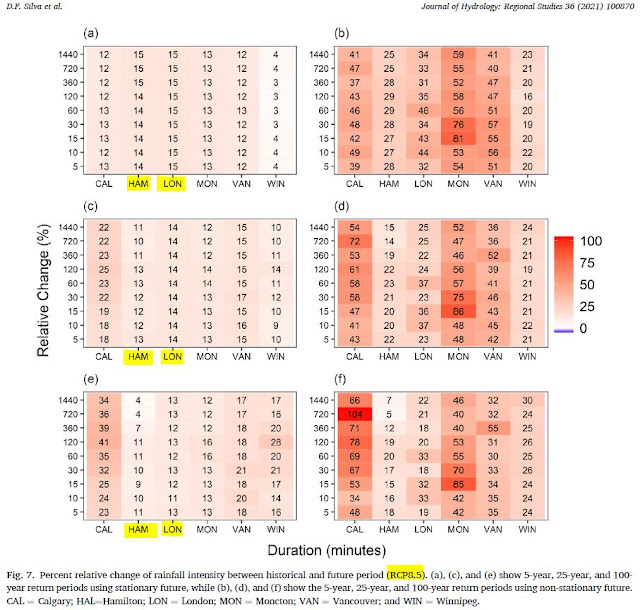
The charts on the above left show changes for stationary distributions, and Hamilton (HAM) and London (LON) columns are highlighted. Those stations were shown to have stationary annual maximum extreme rainfall in the paper, as shared in the previous post. The London and Hamilton 100-year rainfall intensities increase from 4 to 13 percent under the RCP 8.5 emissions scenario (stationary table on the bottom left). 

Under the RCP8.5 scenario the return period of today's 100-year 24-hour becomes smaller, meaning that intensity can occur more frequently than the 1% chance per year today. Today's 5-year 2-hour intensities become more frequent as well. The paper shows these projected intensities: 


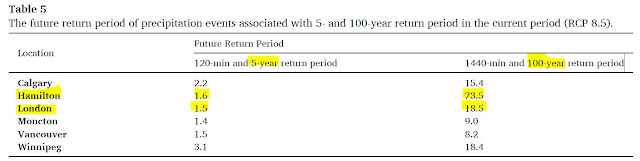
So a 100-year return period 24-hour (1440 minute) intensity becomes a 73.5 year return period intensity or a 18.5 year return period intensity in Hamilton and London, Ontario, respectively.

Supplemental material shows that for other emissions scenarios intensities do not increase
at these Great Lakes climate stations for the rare 100-year intensities. See below:

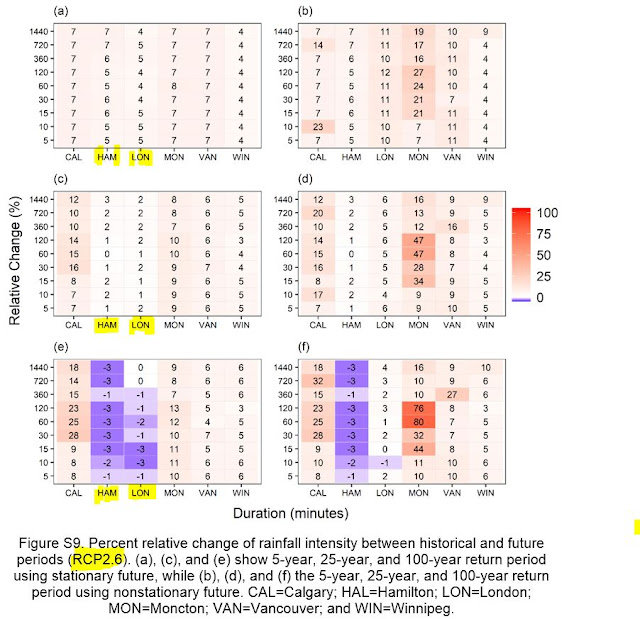
For a RCP2.6 scenario, the 100-year intensities in the table (again on the bottom left for the stationary model), decrease by 3 percent or are unchanged. With those decreases the return period of today's design intensities become longer, meaning today's intensities are less frequent. That means reduced risks for extreme rainfall compared to today.

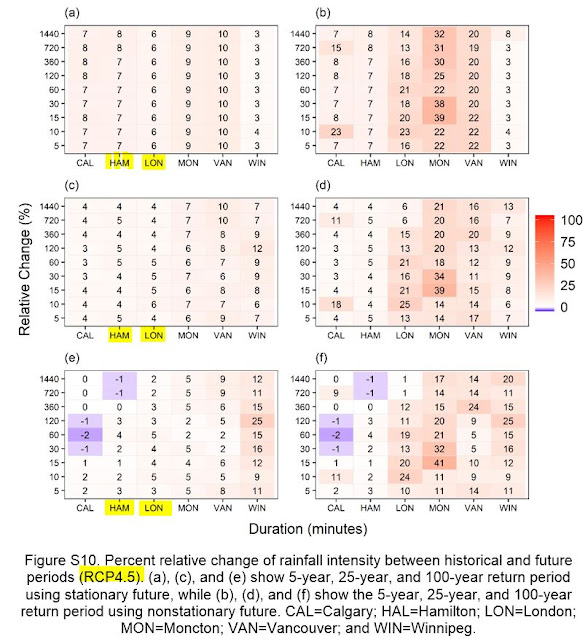
The RCP4.5 scenario projected 100-year intensities are essentially unchanged in Hamilton and up slightly in London: 


So what are future rainfall intensities in Southern Ontario? That depends on the emissions scenario you select.

Recently the Pacific Climate Impacts Consortium questioned if RCP8.5 should be considered as 'business as usual', that is, is it the most likely future scenario? See a detailed discussion in their Science Brief: https://www.pacificclimate.org/sites/default/files/publications/Science_Brief_39-June_2021-final.pdf, an excerpt which is below.


The Science Brief concludes that:

"Given that RCP8.5 is not the most "likely" outcome of emissions following business-as-usual or stated policy intensions, its reasonable to refer to it as a high emissions scenario instead of business-as-usual."

A previous post also noted that others have also questioned the validity of RCP8.5:


ii) Roger Pielke Jr. and Justin Ritchie as reported in Issues in Science and Technology (https://issues.org/climate-change-scenarios-lost-touch-reality-pielke-ritchie/). 

Therefore, the paper's projections for future intensities under RCP8.5 could be considered in stress tests of infrastructure or hydrologic systems. Such tests can identify low-regret design modifications that can be incorporated initially, or to identify future adaptive management if modifications today would be too costly and yield uncertain and limited benefits (i.e., based on the limited likelihood of such severe intensities occurring with less likely scenarios). Assessment of most-likely conditions should consider projected future intensities based on emissions under stated policy intentions, such as presented in the paper's supplemental material (e.g., RCP4.6).

Both the US Federal Highways Administration (FHWA) and the American Society of Civil Engineers (ASCE) have developed risk-based approaches to designing infrastructure for future climate conditions. 

The Canadian government describes a method for projecting future rainfall intensities based on temperature-scaling, considering RCP4.5 and RCP8.5 (see previous post  https://www.cityfloodmap.com/2021/12/adjusting-idf-curves-to-account-for.html). The approach notes one should:
  • Apply risk-based decision-making to choose the future extreme rainfall value that is most appropriate for asset risk thresholds.  For example, if rainfall consequences to infrastructure are severe, consider applying upper end of projected future RCP 8.5 1-hour 1-in-100-year rainfall intensities to infrastructure design.
A robust risk-based approach could also consider other scenarios such as RCP2.6 as well.

It is noted that the ASCE identifies levels of analysis in its Manual of Practice 140 entitled Climate-Resilient Infrastructure: Adaptive Design and Risk Management. In Chapter 7 Adaptive Design and Risk Management the manual provides recommended levels of climate analysis based design life and risk category. The following table excerpt shows the risk categories for buildings and other structure:


These table excerpts show the levels of analysis based on risk category and design life (top table), and the climate analysis characteristics.

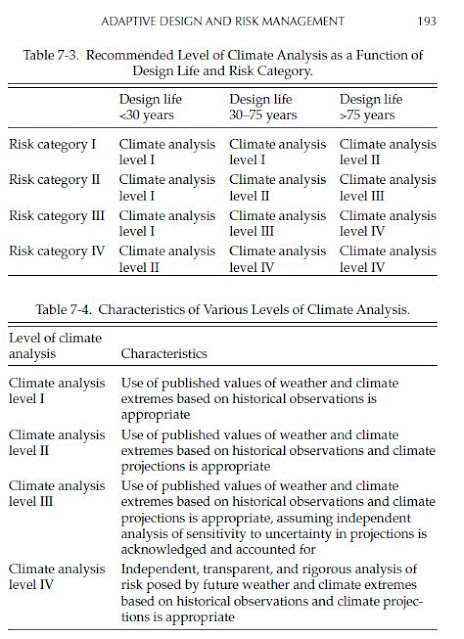
So for buildings and structure with design life up to 75 years, where the risk category is low (Risk Category I, meaning low risk to human life), Level I climate analysis using "extremes based on historical observations is appropriate". For a longer design life beyond 75 years, the Risk Category I buildings and structures (low risk) should also include climate projections per climate analysis Level II. In my opinion, a deterministic future projection could be considered for such analysis based on a likely scenario (e.g., RCP 4.5).

Where there is a 'substantial risk to human life' or hazardous or toxic materials involved under Risk Category III, Level III analysis is recommended by ASCE for moderate design life (30-75 years). Such analysis would account for uncertainty as well, for example, and could consider confidence bands reflecting uncertainty on a future climate projection (e.g., bands surrounding RCP 4.5 projections).

For the highest Risk Category IV that applies to essential buildings and structures that are deemed 'essential facilities' and whose failure could pose 'a substantial hazard to the community', or that involve hazardous/toxic materials, more extensive climate analysis is required (i.e., Level IV). ASCE recommends "rigorous analysis of risk" for moderate design life and longer. Such an analysis could consider a range of scenarios, e.g., from RCP 2.6 to RCP 8.5, and the consequences of exposure to flood hazards. The likelihood of each scenario would have to be estimated to support rigorous risk-based analysis.

Environment Canada Report Confirms No Overall Change in Extreme Rainfall - Generally Random Ups and Downs - Stated Certainty of Future Shifts Contradicts American Society of Civil Engineer's "Significant Uncertainty"

A new Environment and Climate Change Canada (ECCC) report Canada’s Changing Climate Report https://changingclimate.ca/CCCR2019/ reviews past, observed rainfall extremes https://changingclimate.ca/CCCR2019/chapter/4-0/ and confirms there are no observed changes in extreme rainfall across the country:

"For Canada as a whole, there is a lack of observational evidence of changes in daily and short-duration extreme precipitation."

ECCC predicts increases showing a theoretical probability density function shift (Figure 4.21) where the blue line probability density function represents today's/yesterday's eventt magnitudes and frequencies without climate effects, and red represents with effects (shift right means higher magnitude for any frequency):


Engineering Climate Datasets in some regions show trends in the magnitude of rain intensity magnitudes (reality) going the other way however:
https://www.cityfloodmap.com/2019/03/idf-updates-for-southern-ontario-show.html .

This image shows the difference between the theory and the local data reality - the green line is the REALITY showing for any given frequency (2, 10, 50, 100 Year events) the magnitude is going down in southern Ontario:

ECCC suggests there is insufficient data to observe the changes in extremes expected: "Estimating changes in short-duration extreme precipitation at a point location is complex because of the lack of observations in many places and the discontinuous nature of precipitation at small scales." - while that MAY be accurate for extreme events that are rare and elusive, why do 2 Year rain intensities, derived from many, many yearly observations at all long term rain gauges, show the clearest decline, across all durations from 5 minutes to 24 hours?

Surely, we have DO enough point locations and observations to see the change in these small storms. But if these small frequent storm intensities are no higher with today's temperature shifts, why do we expect the extremes to be higher either? Data we do have shows in southern Ontario these 100 year intensities are 0.2% LOWER on average. So extremes are shifting shifting along with the means.... shifting lower.

A theoretical probability density function shift has been promoted in the past by ICLR and IBC in the 2012 Telling the Weather Story report:


This has been shown to be 'made-up' and not related to real data (ECCC IDF tables and charts mistakenly cited as the source of the 40 year to 6 year frequency shift) - this chart shows the theoretical 1 standard deviation shift widely circulated by IBC and real data shifts:

See the difference between theory and data? It is pretty clear.

Given the lack of past trends, and uncertainty in future noted in the ECCC report ("It is likely that extreme precipitation will increase in Canada in the future, although the magnitude of the increase is much more uncertain"), we must follow the American Society of Civil Engineer's recommended "Observational Method" approach see 2015 report Adapting Infrastructure and Civil Engineering Practice to a Changing Climate at http://theicnet.org/wp-content/uploads/2015/07/2015-07-ASCE-Practice-to-Climate-Change-2015.pdf, and also see https://ascelibrary.org/doi/book/10.1061/9780784415191?utm_campaign=PUB-20181023-COPRI%20Alert&utm_medium=email&utm_source=Eloqua# for the new 2018 manual on engineering practice Climate-Resilient Infrastructure, Adaptive Design and Risk Management.

The ASCE 2018 manual promotes incorporating any no-regret, now cost measures in design today considering most probable future conditions, and allowing design flexibility to adapt in the future if and when performance is shown to be inadequate or affected by future changes - this is a practical approach intended to avoid costly over-design, and over-investment in potentially unnecessary and cost-ineffective infrastructure today.

While the ASCE 2015 report notes the high degree of uncertainty "However, even though the scientific community agrees that climate is changing, there is significant uncertainty about the location, timing and magnitude of the changes over the lifetime of infrastructure."

In contrast, the ECCC report appears to asset a high degree of confidence in future changes saying "For Canada as a whole, there is a lack of observational evidence of changes in daily and short-duration extreme precipitation. This is not unexpected, as extreme precipitation response to anthropogenic climate change during the historical period would have been small relative to its natural variability, and as such, difficult to detect. However, in the future, daily extreme precipitation is projected to increase (high confidence). - how can ECCC assert high confidence when there are no observed trends? How can ECCC contradict ASCE's statement on high "signifcant uncertainty'?

ECCC reports that summer precipitation is expected to decrease: "Summer precipitation is projected to decrease over southern Canada under a high emission scenario toward the end of the 21st century, but only small changes are projected under a low emission scenario." - how can that be if the summer temperatures are going up? Does this not violate the Clausius-Clapeyron theory cited in the ECCC report states that "increased atmospheric water vapour in this part of the world should translate into more precipitation, according to our understanding of physical processes" - so that is a theory - what about the real data? What does it show? the Clausius-Clapeyron relationship does not stand up to scrutiny as shown in a previous post.

Given highest rainfall extreme are in the summer (see the work of Dr. Trevor Dickinson on seasonal extremes), a summer decrease in precipitation could potentially mean lower flood risks. The data for southern Ontario already show a decrease in the annual maximum series (reflecting lower means and typical 2 Year design intensities in derived IDF curves) and the extreme 100 Year design intensities are decreasing slightly as well.

Overall, many in the media have over-hyped concerns about changing rainfall severity. Data and ECCC's report shows there has been no change, beyond random fluctuation. Looking ahead the American Society of Civil Engineers indicates that future changes have "significant uncertainty"- this contracts the ECCC's statement on "high confidence" on future extremes.