Unit cost data for various green infrastructure, or Low Impact Development (LID) stormwater management practices, are provided in Capital Region Water's costing tool and it's reference Appendix B - Basis of Cost Opinions, Combined Sewer Overflow Control Alternatives, Costing Tool Reference Manual, Updated 2017 (https://pdf4pro.com/cdn/appendix-b-basis-of-cost-opinions-capital-6c71f.pdf).
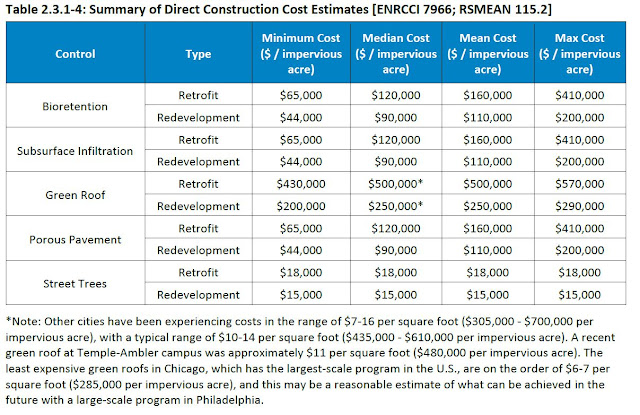
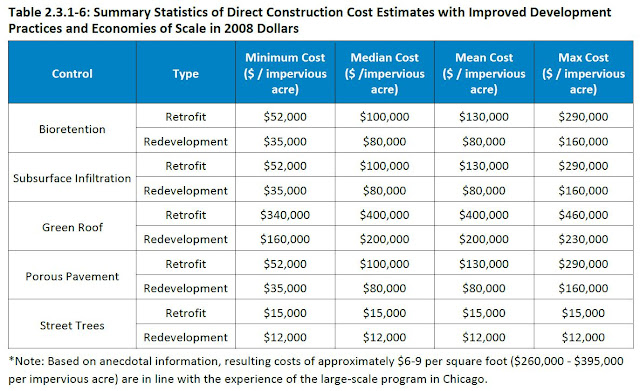
The following tables illustrate 2008 unit costs per impervious acre. The first considers costs with limited cost efficiencies or savings over current costs. The second table considers that cost reductions can be achieved under widespread implementation with economies of scale.
 |
| Green Infrastructure Costs in Retrofit and Redevelopment Settings - Bioretention, Subsurface Infiltration, Green Roof, Porous Pavement, and Street Trees - 2008 Dollars, Harrisburg, PA, USA |
The unit costs above, excluding green roofs and streets trees, result in a mean cost of $160,000 per impervious acre for retrofits and $110,000 for redevelopment. This equates to mean costs of $395,000 and $272,000 per impervious hectare.
Adjusting costs to 2020, based on the Statistics Canada Infrastructure Construction Price Index, increases 2008 costs by 30%. The following table presents 2020 estimated unit costs per impervious hectare.
Summary Statistics of Direct Construction Cost Estimates in 2020* Dollars ($/impervious hectare) |
|||||
| Control Type | Minimum Cost ($ / impervious hectare) |
Median Cost ($ / impervious hectare) |
Mean Cost ($ / impervious hectare) |
Max Cost ($ / impervious hectare) |
|
| Bioretention | Retrofit | $209,000 | $386,000 | $514,000 | $1,317,000 |
| Redevelopment | $142,000 | $289,000 | $354,000 | $642,000 | |
| Subsurface Infiltration | Retrofit | $209,000 | $386,000 | $514,000 | $1,317,000 |
| Redevelopment | $142,000 | $289,000 | $354,000 | $642,000 | |
| Green Roof | Retrofit | $1,382,000 | $1,607,000 | $1,607,000 | $1,830,000 |
| Redevelopment | $642,000 | $803,000 | $803,000 | $932,000 | |
| Porous Pavement | Retrofit | $209,000 | $386,000 | $514,000 | $1,317,000 |
| Redevelopment | $142,000 | $289,000 | $354,000 | $642,000 | |
| Street Trees | Retrofit | $57,000 | $57,000 | $57,000 | $57,000 |
| Redevelopment | $48,000 | $48,000 | $48,000 | $48,000 | |
| Average Excl. Green Roof and Street Trees | Retrofit | $209,000 | $386,000 | $514,000 | $1,317,000 |
| Redevelopment | $142,000 | $289,000 | $354,000 | $642,000 | |
* 2008 to 2020 adjustment estimated at +30% considering Infrastructure construction price index (+26.9% for 2010-2019)
The average retrofit cost for bioretention, subsurface infiltration and porous pavement is $514,000 per impervious hectare for retrofits and $354,000 per impervious hectare for redevelopment. Lower costs with expected cost efficiencies are estimated below, adjusting 2008 cost to 2020 (i.e., increase by 30%).
| Summary Statistics of Direct Construction Cost Estimates with Improved Development Practices and Economies of Scale in 2020 Dollars ($/impervious hectare) | |||||||
| Control Type | Minimum Cost ($ / impervious hectare) |
Median Cost ($ / impervious hectare) |
Mean Cost ($ / impervious hectare) |
Max Cost ($ / impervious hectare) |
|||
| Bioretention | Retrofit | $166,000 | $321,000 | $417,000 | $932,000 | ||
| Redevelopment | $112,000 | $257,000 | $257,000 | $514,000 | |||
| Subsurface Infiltration | Retrofit | $166,000 | $321,000 | $417,000 | $932,000 | ||
| Redevelopment | $112,000 | $257,000 | $257,000 | $514,000 | |||
| Green Roof | Retrofit | $1,092,000 | $1,284,000 | $1,284,000 | $1,478,000 | ||
| Redevelopment | $514,000 | $642,000 | $642,000 | $738,000 | |||
| Porous Pavement | Retrofit | $166,000 | $321,000 | $417,000 | $932,000 | ||
| Redevelopment | $112,000 | $257,000 | $257,000 | $514,000 | |||
| Street Trees | Retrofit | $48,000 | $48,000 | $48,000 | $48,000 | ||
| Redevelopment | $39,000 | $39,000 | $39,000 | $39,000 | |||
| Average Excl. Green Roof and Street Trees | Retrofit | $166,000 | $321,000 | $417,000 | $932,000 | ||
| Redevelopment | $112,000 | $257,000 | $257,000 | $514,000 | |||
| The retrofit and redevelopment costs of $417,000 to $257,000 per impervious hectare would be equivalent to costs of $834,000 to $514,000 per hectare, assuming 50% impervious coverage. These costs are of similar magnitude to average Ontario and Alberta LID project costs presented in an earlier post (see update at the bottom of the post https://www.cityfloodmap.com/2019/10/green-infrastructure-cost-ontario.html). Compiled LID project costs indicate an average area-weighted cost of $540,000 per hectare, including several recent project costs that have not yet been adjusted, i.e., increased, to today's 2020 dollars. While project costs are expected to vary from site to site, average unit costs may be used for planning purposes, when evaluating the cost to retrofit large areas, e.g., sewer catchments or tributary subwatersheds where stormwater management controls are being evaluated. *** Notes: while economies of scale have been assumed with widespread implementation, trends in unit costs in Philadelphia had not yet revealed decreasing unit costs as indicated in an earlier post (https://www.cityfloodmap.com/2018/07/green-infrastructure-capital-and.html) and as shown in the chart below:
|
|||||||


