Showing posts with label top weather story. Show all posts

Why Flood Damages Are Increasing In Canada - Rain or Runoff?

Runoff is the key factor, not rain. Drainage system design comes into play as well.
Intensification of subdivisions has more than doubled since the 1950's increasing from less than one third impervious area coverage to more than two thirds in the last 15 years.
Extreme rainfall is decreasing as shown in Environment and Climate Change Canada's Engineering Climate Datasets. Are scientists being muzzled? In Southern Ontario for example, more statistically significant decreasing trends are observed than increasing trends:

Most changes in rainfall intensity are mild trends, not statistically significant. Version 2.3 Engineering Climate Dataset.

Note that some increased intensity observations are a function of the intrinsic sample bias of the underlying skewed rainfall probability density function. This is important for drainage design and should be considered, but does not indicate a change in the underlying 'population' being observed/sampled (i.e., increases not necessarily a change in fundamental rainfall characteristics due to climate change).

Because flood damages are increasing, could it be the increased runoff due to intensified development contributes to flooding? Yes. The GIS analysis of a city in York Region up top shows how the percentage of impervious area has increased from the 1950's when less than one third of land was hardened with road, rooftops and driveways, to the early 2000's when over two thirds of land was hardened.

Ironically though, the pre 1980's subdivisions may have the greater basement back-up risk because of the partially separated sanitary sewer systems and high wet weather inflows during extreme storm events. These unwanted inflows are sometimes 10 times the inflow allowance in new subdivisions where systems are fully separated (i.e., foundation drains connected to the storm sewer instead of sanitary). Also the overland drainage in the pre 1980's subdivision may not safely follow the roadway but instead travel across private lots, into window wells and basement walkouts aggravating impacts to the sanitary sewer, despite the lower overall runoff rates.

The lesson? Changing rainfall patterns do not explain increased flooding in urban areas in Canada. Increased runoff is dramatic but may be managed in new subdivisions with more resilient design standards (fully separated sanitary sewers, and controlled overland grading patterns). Look for a future post on intensification in existing serviced areas and impacts on the original sewer and drainage systems.

It is time to move past infographics (below) and consider real data when assessing flood risks and developing evidence-based flood mitigation policies in Canada:

Sorry. We don't know what this means or what it is based on ... just that it is from the Ontario government and is a distraction to for any meaningful analysis or discussion on flood management.

Ontario Climate Change Trends: "Going Down South, Heading Up North" or Bias in Skewed Distribution Sample Means?

The following tables and charts show extreme rainfall trends in Ontario, Canada based on observed annual maximum rainfall depths from Environment and Climate Change Canada.

Observed trends show that more southern climate stations have statistically significant decreasing rainfall intensity trends than increasing trends (2.3% compared to 1.0%). In justification for cap and trade in Ontario, scientists and engineers seem to have been muzzled from sharing these simple facts which contradict Ontario's rationale for mitigating climate change. Extreme storms are not increasing as temperature is. Factually, all we have is global warming and no change in rain/weather.

Ontario climate change


Trends for these southern Ontario (i.e., stations  below 44 degree latitude) are shown graphically below:

Ontario climate change storm

For northern Ontario climate stations there are more increasing than decreasing trends.

Ontario climate change IDF

Ontario climate change rain


Over time, the average maximum rainfall intensity is statistically expected to increase as the sample size increases, without indicating a change in the underlying rainfall characteristic. This is so for all skewed probability distributions as any additional sample values (i.e., annual observations) that fall in the extreme tail push the observed mean higher. To illustrate the skew in observations, the following table excerpt from Environment Canada's IDF table (idf_v2-3_2014_12_21_615_ON_6158355_TORONTO_CITY.txt) shows the positive skew values for 5 minute to 24 hour annual maximum observations from 1940 to 2007:

Ontario storms climate change
Toronto City (station ID 6158355). Positive skew in rainfall distribution for all storm duration. Coefficients of variation of
0.408, 0.355, 0.400, 0.419, 0.393, 0.360, 0.349, 0.318, and 0.306 indicate that sample mean will be biased for small sample sizes, resulting in increased rainfall intensities over time as sample size increases and positive skew observations are added to the sample mean result. Hence mean extreme rainfall will increase without an increase in the underlying rainfall patterns, but instead as a result of the sampling methodology for small sample sets of  rainfall 'population' with a skewed probability density function (i.e., stationary distribution with no underlying climate change related trends in extreme rainfall). 

The following charts show histograms of 5 minute and 24 minute annual maximum observations for Toronto City gauge, illustrating this skew characteristic.


The following charts show how sample size affects the ability of samples observations to approximate the mean of an underlying distribution, and how population skew affects the trend in samples mean. This is from Kirk G. Fleming's article "Yep, We’re Skewed", VOLUME 2/ISSUE 2 CASUALTY ACTUARIAL SOCIETY.


Mr. Fleming writes: "Figure 1 shows three lognormal curves, each with a mean of 1,000 and with varying degrees of skewness. As the skewness increases, the mode or highest point on the distribution is associated with points closer and closer to zero.1 For a lognormal distribution with a coefficient of variation (CV) of 2.0, the most likely value for a sample size of one is relatively close to zero, no matter how big the mean of the distribution. For small samples from this skewed distribution, the most likely value for the sample average will be close to zero.

In order to give a feel for what makes up a small sample size, I simulated random values from a lognormal distribution with a mean 1,000 and varying degrees of skewness. The modes for the sample averages of various sizes are shown in Figure 2 for lognormal distributions with a mean of 1,000 and CVs of 0.5, 1.0, 2.0, 5.0 and 10.0. For individual claim size distributions that have low skewness, the most likely value that we will see from a sample average very quickly approaches the mean of the distribution. Many introductory statistical textbooks give a rule of thumb that infinity begins at a sample size of 30, and for low skewness 30 does seem to be a magic number when we are dealing with the lognormal distribution. However, as the skewness increases, it takes a very big sample size before the most likely value of the sample average approaches the mean of the sampled claim distribution.

For a lognormal distribution with a CV of 10, even at a sample size of 500, the most likely value we would see from the sample average is 85% of the distribution mean. Formal credibility formulas aside, I believe many actuaries would consider 500 homogeneous claims to be a fairly large database.

With a CV of 10 and a sample size of 10,000, the most likely value we would see is still only 96% of the mean of the distribution. A simulation size of 10,000 is not an uncommon size for actuaries doing simulations. Even with this large sample, there is still a downward bias of 4% from the actual average of the distribution."

****

Looking at Toronto rainfall data, assuming a log normal distribution of annual extremes as in Fleming's example, and that the CV is in the range of 0.3 to 0.4, this suggests a sample mean would increase over the first decades of the observations as it approaches the true population distribution, and would stabilize near the true mean after 25 years or so. Accordingly, any short duration climate station data trends would increase over time. The median record length (number of samples) is 24 years, indicating that many stations would have a bias in rainfall intensity trend. The natural, statistical increase in rainfall can be confused with a change in underlying rainfall intensity (e.g., due to climate change), whereas the observed increase in extreme intensity is only a known sampling bias in a skewed rainfall probability distribution.

Rainfall sample mean bias for skewed distribution results in samples means that are less than the underlying population mean. Underestimation bias increases with higher skew distributions.


****

Extreme rainfall trends in Canada (Environment Canada Engineering Climate Datasets):

Static Maps: http://www.cityfloodmap.com/2015/12/severe-storm-trends-canada-rainfall.html
Interactive Map: http://www.cityfloodmap.com/2015/12/canadian-extreme-rainfall-map-climate.html
Table Summaries: http://www.cityfloodmap.com/2015/12/canadian-extreme-rainfall-summary-by.html
Chart and Table: http://www.cityfloodmap.com/2015/12/top-weather-story-in-canada-2015-less.html
Long-term Station Table: http://www.cityfloodmap.com/2015/12/long-term-climate-change-short-term.html
Environment Canada Denies Changes: http://www.cityfloodmap.com/2015/10/bogus-statements-on-storms-in-cbcnewsca.html
Contradicting Insurance Industry Claims: http://www.cityfloodmap.com/2015/12/trends-in-canadian-shortduration.html

Climate Change Ontario - Short Duration Rainfall Trends - Less Severe Southern Storms

Ontario climate changeEnvironment and Climate Change Canada's Engineering Climate Datasets' rainfall trend data have been summarized to show Ontario climate change trends. Data have been screened to show recently active rainfall gauge observations with more reliable, longer term records.

The summary tables below show rainfall intensity trend data for stations in southern Ontario (south of latitude 44 degrees), with over 30 years of record. The majority of trends are not statistically significant, and there are slightly more decreasing rainfall intensity trends than increasing ones. The summary table trends correspond to observed annual maximum recorded rainfall depths over various short durations. Have scientists been muzzled by the federal government from sharing this? Have Ontario scientists and engineers missed the facts that don't support the rationale for cap and trade, Bill 172?

The trend data are available in the version 2.3 dataset (file: idf_v2-3_2014_12_21_trends.txt, in
IDF_Additional_Additionnel_v2.30.zip, available at:
ftp://ftp.tor.ec.gc.ca/Pub/Engineering_Climate_Dataset/IDF/)

Ontario climate change storms
Southern Ontario Rainfall Intensity Trends. Stations below latitude 44 degrees and with a least 30 years of record focus on south and western stations (no tranditional south east municipalities).
Individual cells in the table correspond to trend lines on individual, observed maximum rainfall charts. Below, a table with longer term stations (> 45 years of record) across all Ontario are shown with corresponding charts. For the Ottawa CDA RCS climate station, shortest duration extreme rainfall volumes and intensities are decreasing for 5 minutes to 3 hour durations, corresponding to the 6 left-most, light-green cells in the table, and the top and right 6 trend charts/times series plots. The next 2 light-red cells and bottom left charts show increasing 1 hour and 2 hour intensities. The last cell in the row and bottom chart shows increasing rainfall intensities over 24 hours - this trend is statistically significant at the 5% level, and so that chart includes the "Trend: +" note.

Ontario climate change storms

Rainfall trend data for the Toronto Pearson International Airport gauge data, located in the City of Mississauga, show a mixture of decreasing short and long duration extreme rainfall observations (5 minute, 6 hour, 12 hour, and 24 hour durations). and increasing mid duration observations (10 minute to 2 hour durations), but not statistically significant trends. The "Trend: N" note at the top of all charts here signifies no statistically significant changes in extreme rainfall characteristics.

Ontario climate change rain

The historical rainfall observations for the central Toronto, Toronto City climate station, show decreasing extreme rain for all durations. Trends for 5 minute to 2 hour durations are mild and not statistically significant. Decreasing trends over 6 to 24 hour durations are stronger and are classified by Environment and Climate Change Canada as statistically significant - such charts include the "Trend: -" note.

Ontario climate change flooding
Overall with the Southern Ontario long term, recent observations, more statistically significant decreasing rainfall intensities have been recorded (8 data points), than increasing intensities (4 data points). The statistically significant decreasing extreme rain data are clustered across storm durations in Toronto and Winsdor.

The only stations with no decreasing rainfall trends are Bowmanville and Oshawa, and the only ones with no increasing rainfall trends are Toronto, Windsor and Hamilton.

The table below shows Ontario extreme rainfall trends for all stations, including inactive ones and those with short records. Overall, there are no significant trends for over 93% of data points, with about 5% of data showing statistically significant increases and 2% showing decreases.

Ontario climate change storms

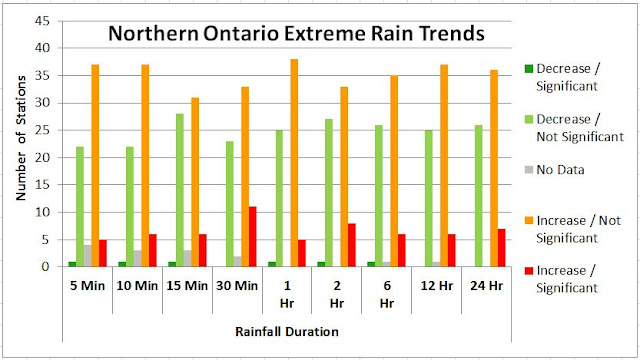
"Northern" Ontario stations show a greater increase in intensity than southern ones. The table below is similar to the first table, and includes more reliable long term record, recently active stations. Some traditional central and eastern Ontario stations above 44 degrees are included in this definition. Decreasing rainfall trends appear prevalent in the central and eastern stations spanning between -Kingston-Brockville-Cornwall-Kemptville-Ottawa. Increasing rainfall trends are more prevalent at the far north stations.
Northern Ontario climate change
"Northern" Ontario extreme rainfall trends. Includes central and eastern Ontario stations below 44 degrees latitude.

Extreme rainfall trends in Canada (Environment Canada Engineering Climate Datasets):

Static Maps: http://www.cityfloodmap.com/2015/12/severe-storm-trends-canada-rainfall.html
Interactive Map: http://www.cityfloodmap.com/2015/12/canadian-extreme-rainfall-map-climate.html
Table Summaries: http://www.cityfloodmap.com/2015/12/canadian-extreme-rainfall-summary-by.html
Chart and Table: http://www.cityfloodmap.com/2015/12/top-weather-story-in-canada-2015-less.html
Long-term Station Table: http://www.cityfloodmap.com/2015/12/long-term-climate-change-short-term.html
Environment Canada Denies Changes: http://www.cityfloodmap.com/2015/10/bogus-statements-on-storms-in-cbcnewsca.html
Contradicting Insurance Industry Claims: http://www.cityfloodmap.com/2015/12/trends-in-canadian-shortduration.html


Long Term Climate Change - Short Term Extreme Rainfall Impacts - What Muzzled Scientists Can't Say


Previous posts have summarized trends in extreme rainfall for 565 climate stations across Canada. Its clear that while temperatures are up (global warming), climate change impacts are not affecting storm intensity.

Tables and maps have shown the trend direction (increasing or decreasing) and the strength of the trend (statistical significance). The complete list includes "out of service" stations and those with short periods of record, meaning their data are not as relevant to recent climate change trends. 
To focus on recent trends and more reliable long term records, the table below screens Environment Canada's stations to show only those with more than 45 years of record, and those whose last record is more recent than 2005. Only 26 stations meet this quality screening for long term, recent data sets.

Findings:

Short term extreme weather trends in western Canada show no statistically significant increase or decrease, meaning trends are minor / mildIncreases (shown as light red shading) are more prevalent than decreases (light green shading). Decreases have been observed over short durations (e.g., Calgary 5 and 10 minutes) and longer durations (e.g., Vancouver 6, 12 and 24 hour periods).

In Ontario, decreases in rainfall intensity are slightly more prevalent than increases. Statistically significant decreasing trends in rainfall extremes were observed in southern Ontario at two stations: Windsor Airport and Toronto City (aka 'Bloor Street'), shown with dark green shading. These decreases were for 7 statistics covering both short and long durations (10 minutes to 24 hours). Statistically significant increases were observed in eastern and northern Ontario for two statistics: Thunder Bay 30 minute duration, and Ottawa Airport 24 hour duration.
In the Maritimes and Newfoundland, increases are more prevalent than decreases. Statistically significant increases were observed in Moncton, New Brunswick, Shearwater Nova Scotia, and Gander, Newfoundland.

Climate Station
Province / Region
Station ID
Engineering Climate Datasets
Annual Maximum Rainfall
Trend and Significance
Length
of
Record (Years)
Most

Recent

Year
5 min 10 min  15 min 30 min
1
hr
2
hr
6
hr
12 hr 24 hr
British Columbia
Victoria Intl A BC        1018621 4 4 4 4 4 4 4 4 4 46 2013
Mission West Abbey BC        1105192 4 4 4 2 2 2 4 4 4 48 2010
Vancouver Intl A BC        1108395 4 4 4 4 4 4 2 2 2 59 2013


Alberta
Edmonton Int'L A AB        3012205 4 2 2 2 4 4 2 2 4 46 2011
Red Deer A AB        3025480 4 4 4 4 4 4 4 4 4 47 2012
Calgary Int'L A AB        3031093 2 2 4 4 4 4 4 4 4 56 2009


Saskatchewan
Estevan A SK        4012400 4 4 4 4 4 2 4 2 4 48 2011
Kindersley A SK        4043900 4 4 4 4 4 4 4 4 4 47 2013


Ontario
Ear Falls (Aut) ON        6012199 4 4 4 4 2 2 4 4 4 49 2006
Geraldton A ON        6042716 4 4 4 4 4 4 4 4 4 48 2006
Thunder Bay Cs ON        6048268 4 4 4 5 4 4 4 4 4 47 2006
Timmins Victor Power A ON        6078285 4 4 4 4 4 4 2 2 2 47 2006
Kingston Pumping Station ON        6104175 4 4 2 2 2 2 2 2 2 63 2007
Ottawa Cda Rcs ON        6105978 2 2 2 2 2 2 4 4 5 50 2007
St Thomas Wpcp ON        6137362 4 2 2 2 4 2 4 4 4 75 2007
Windsor A ON        6139525 2 1 2 2 2 1 1 1 2 60 2007
London Cs ON        6144478 4 4 4 4 2 2 2 2 2 57 2007
Toronto City ON        6158355 2 2 2 2 2 2 1 1 1 59 2007
Toronto Intl A ON        6158731 2 4 4 4 4 4 2 2 2 60 2013


Maritimes / Newfoundland
Charlo Auto NB        8100885 4 4 4 4 4 4 4 4 4 51 2013
Moncton Intl A NB        8103201 4 4 4 4 4 4 4 5 5 64 2013
Sable Island NS        8204700 4 4 4 4 4 4 4 4 2 50 2012
Shearwater Auto NS        8205091 4 4 4 5 4 4 4 4 4 53 2009
Sydney Cs NS        8205702 4 4 4 4 4 4 4 2 4 50 2013
Gander Airport Cs NL        8401705 4 2 2 4 4 4 5 5 5 65 2009
Goose A NL        8501900 4 4 4 4 4 4 4 2 2 50 2013

****
Sensitivity analysis on the screening criteria do not change the overall trends. We looked at period of record greater than 38 years, instead of 45 years, and this doubled the number of stations. Highlights:
  • The Ottawa International Airport station was added and had a statistically significant decrease in short term rainfall intensity (10 minutes, 15 minutes, 1 hour) - this is consistent with Ottawa CDA which had decreasing non-significant trends for 5 minute to 2 hour durations.
  • In the northern Ontario, Sault St. Marie Airport was added with a statistically significant increase over a one hour duration, just like Thunder Bay.
  • Statistically significant increases in rainfall over long durations (12-24 hours) were added in British Columbia (Tofino Airport, Blue River Airport).
  • A statistically significant increase was added at Fredericton CDA (5 minute duration).
Environment Canada's recent article on extreme rain trends published in Atmosphere-Ocean confirms there are no overall trends in rain intensity, and there are some regional minor increases and decreases - click for abstract.