Showing posts with label trends. Show all posts

Toronto Extreme Rainfall Trends - 100-Year Daily Rainfall in Engineering Climate Datasets

Previous posts have reviewed trends in extreme rainfall across Canada, in various regions including southern Ontario, and in the Greater Toronto Area (GTA), including Toronto and Mississauga where long-term climate data is available for review.

Projections of future extreme rainfall increases are commonly made as part of climate change studies. A review of past trends in extreme rainfall was made in the 2021 National Research Council flooding cost benefit guidelines, as summarized in a previous post. The following chart was included in those guidelines and shows the trends in 100-year daily rainfall at two GTA climate stations in downtown Toronto and at Pearson International Airport in the adjacent municipality of Mississauga.

Toronto 100-Year Rainfall Trends and Projections

The chart shows the 100-year rainfall depth using data records up to 1990 and then adding more recent data up to 2017. The chart shows that the 100-year rainfall at Pearson Airport/Mississauga has been decreasing slightly when recent data is added after 1990. Meanwhile the Toronto rainfall has been increasing slightly (see dotted and dashed black lines on the chart above for the trends).

Several climate studies have projected that the 100-year daily rainfall would increase over coming decades as shown on the chart. The Toronto's Future Weather & Climate Driver Study by SENES projected a doubling of this rainfall statistic by 2040-2049, relative to a 2000-2009 baseline value (see the orange dashed line on the chart above, where the 2000-2009 value is shown at 2005 and the 2040-2049 value is shown at 2045).

Some additional data has been analyzed by Environment and Climate Change Canada for the Toronto climate station, now including data up to 2021. This allows the 100-year daily rainfall statistic to be updated with a few more years of data. The chart below shows the additional Toronto data point circled in yellow at 2021.

100 Year Daily Rainfall Trends in Toronto and Mississauga and Climate Projections

While the Toronto rainfall statistic up to 2017 was 97.5 mm, the value up to 2021 decreased slightly to 97.3 mm. The value up to 2017 reflected the prior July 8, 2013 extreme event, creating a jump after 2007 when the value was slightly lower at 94.7 mm. As more data is observed below the 2013 extreme, the statistic should continue to decrease as more data is added and analyzed.

The take-away? Observational data, including data up to 2021, does not support the projected significant increases in 100-year daily rain in climate studies. The Toronto data is available over the period of 1940 to 2021.

How far off are the projected increases in extreme rainfall? The Toronto Future Weather & Climate study projected a theoretical 31mm/decade increase over 40 years - that was for Pearson Airport climate station. Actual data at Pearson Airport shows an observed increase of only 3.1mm/decade.  This considers a value of 115.1 mm in the middle of the 1950-2003 period and a value of 125.5 mm for 2003-2017 - that later value is estimated to generate the current value of 117.3 mm by using a weighted average across all years from 1950 to 2017. For Toronto the actual increase is only 2.0 mm/decade.

On average the GTA (Toronto and Pearson/Mississauga) increase is about 2.5 mm/decade, or less than a tenth of almost 31mm/decade projected in the SENES climate/future weather study.

***

Further reading in previous posts on extreme rainfall trends:

1) Rainfall intensity trends in Canada:

a) 226 long term climate stations in the Engineering Climate Dataset are used to show actual trends between rain intensity statistics up to 2007 and then up to 2017: https://www.cityfloodmap.com/2020/12/design-rainfall-trends-in-canada.html

b) more of the above plus observed annual maxima rainfall trends as reported in the 2021 National Research Council of Canada (NRC) "National Guidelines on Undertaking a Comprehensive Analysis of Benefits, Costs and Uncertainties of Storm Drainage and Flood Control Infrastructure in a Changing Climate": https://www.cityfloodmap.com/2022/02/nrc-national-guidelines-on-flood.html

2) Rainfall intensity trends in Southern Ontario:

a) ECCC's Engineering Climate Dataset Intensity Duration Frequency (IDF) trends for long-term southern Ontario climate stations, comparing statistics up to 1990 and current values (v3.3 datasets with some station data up to 2021): https://www.cityfloodmap.com/2023/05/southern-ontario-extreme-rainfall.html

3) Rainfall extreme reporting (?) in the media (including Toronto, Mississauga trend review):

a) Thinking Fast and Slow About Extreme Weather and Climate Change, inspired by the late Daniel Kahneman (RIP good sir), exploring the cognitive biases in extreme rainfall reporting in the media: https://www.cityfloodmap.com/2015/11/thinking-fast-and-slow-about-extreme.html

b) my paper with "Thinking Fast and Slow" themes published in the Journal of Water Management Modelling with the title "Evidence Based Policy Gaps in Water Resources: Thinking Fast and Slow on Floods and Flow": https://www.chijournal.org/C449


4) Local studies that observed no increases in design rainfall when updating IDF values:


While media and the insurance industry has repeated that climate change has been responsible for increased flood damages and insurance claims over past decades, the lack of increases in extreme rainfall means that other factors are at play. These include fundamental changes in hydrology in urbanized communities, e.g., increased watershed development and intensification. See previous posts for some examples of expanding urbanization in Ontario communities over previous decades: https://www.cityfloodmap.com/2016/08/land-use-change-drives-urban-flood-risk.html

When fact checkers look into media statements regarding extreme rainfall trends, including the CBC and Radio Canada Ombudsmen offices, data shows no overall increase in extreme rain across Canada. This post shares corrections made by the CBC over recent years: https://www.cityfloodmap.com/2019/06/cbc-correcting-claims-on-extreme.html

Can We Use Daily Rainfall Models To Predict Short Duration Trends? Not Always - Observed Daily and Short Duration Trends Can Diverge

One can assess trends in rainfall intensities over various durations and return periods using Environment Canada's Engineering Climate Datasets.  National trends based on updating 226 station IDF curves were shown in an earlier post.

What are the trends in regions of Canada that have experienced significant flooding in the past?  And do the trends projected by models for long durations (1 day precipitation) match observed data trends?  No - some 24-hour trends are decreasing despite models estimating they will go up (or have gone up because of increasing temperatures).

Also, what is happening with observed short duration intensities, the ones responsible for flooding in urban areas, compared to the observed 1-day trends?

The data show short duration and long duration trends diverge. Therefore relying on models of 1 day precipitation to estimate what is happening with short duration, sudden, extreme rainfall should be done with caution.

A couple charts help illustrate these observed data trends and show what is wrong with relying directly on models to project local extreme rainfall.

This is the trend in observed rainfall for southern Ontario climate stations, using median changes in IDF statistics:

Southern Ontario Extreme Rainfall Trends

Long duration intensities are decreasing and short duration intensities are decreasing even more.  The extreme intensities (red dots = 100 year, orange dots = 50 year) decrease more than the small frequent storm intensities (green dots = 2 year).  Observed data diverges from Environment Canada models that suggest intensities are going up due to a warmer climate (see recent CBC article).

These are the trends for Alberta observed rainfall when new data are added and are reflected in the most current v3.10 datasets:

Alberta Extreme Rainfall Trends

In Alberta, long duration intensities decrease significantly (100 year is down by 4% on average).  Meanwhile the short duration intensities increase.  The long duration decrease is contrary to Environment Canada's simulation models that estimate 1 day rainfall at a sub-continental scale.

In northern Ontario, trends are different than in southern Ontario as shown below:

Northern Ontario Extreme Rainfall Trends

In northern Ontario the long duration intensities have increased but short duration intensities have decreased on average.  So we see short and long duration rainfall trends are diverging when we consider new data.

Climate modellers may suggest that simulated 1 day precipitation can guide what happens during short durations too.  Observed data suggest otherwise.  Trends actually diverge.

In brief, for this sample of regions shown above, we see these trends:

Location                 Short Duration Trend         Long Duration Trend

Southern Ontario      Larger Decrease                        Decrease
Northern Ontario            Decrease                              Increase
Alberta                            Increase                               Decrease

Remember "All models are wrong, some are useful".  Climate models do not accurately project changes in extreme rainfall in Canada based on observed data.  Furthermore, simulated 1 day precipitation trends from models cannot be used to assume short duration trends related to flooding in urban areas - short and long duration rainfall trends are observed to change in opposite directions in sample regions across Canada.

When using 1 day rainfall trends to estimate short duration trends, given the actual observed data trends above, it may be appropriate to conduct sensitivity analysis on potential shorter duration trends, especially if those shorter durations influence system behaviour (e.g., 'flashy' urban drainage systems).  Those short duration trends trends may be in an opposite direction or magnitude than the 1 day trends. For example, in Northern Ontario the 1 day 100-year intensities have increased 2% as a result of the most recent IDF data updates, however the intensities for durations of 2 hours or less have mostly decreased.

The following chart compares the 30 minute, 1 hour and 2 hour 100-year intensity trends with the 24 hour 100-year trends at 226 climate stations across Canada.


The correlation of short duration trends with 24 hour trends is weak with R-squared value of 0.12 for 2 hour trends, 0.06 for 1 hour trends and 0.006 for 30 minute trends.  This suggests that short duration trends are not correlated with 24 hour trends.   

***

Given recent flooding in British Columbia, it is worthwhile looking at trends in design rainfall intensities in BC. This chart shows that extreme rainfall intensities (red dots with 100-year return period, orange dots with 50-year return period) have not increased for most durations - the 12 hour duration intensities are up slightly on average (less than 0.5% increase), while other duration intensities have decreased by more than 2 % on average (5-minute 100-year intensities).


For the longest duration of 24 hours, intensities have decreased on average - typical 2-year intensities are unchanged on average while the moderate and extreme intensities (5-years, 10-year, 25-year, 50-year and 100-year) have decreased on average.

The following tables shows trends in observed annual maximum rainfall over various durations at BC climate stations with long-term records. These are called the Annual Maximum Series (AMS). Trends in derived design rainfall intensities above (e.g., 2-year to 100-year rainfall rates) follow these trends in AMS.


How Have Rainfall Intensities Changed in Canada Over the Past 10 Year? Not Much. Extreme 100-Year Rainfall and Short Duration Intensities Causing Flooding Are Lower

Environment and Climate Change Canada's Engineering Climate Datasets including rainfall intensity duration frequency (IDF) statistics are regularly updated as observation records become longer, and more and more stations have sufficient data to analyze.

What do the recent updates show? There is no new normal in design rainfall intensities.  Over the past 10 years, the severity of extreme rainfall has decreased on average.

Short duration sudden rainfall rates responsible for flooding in urban areas have also decreased overall - only the frequent, low intensities show an overall increase, which can be expected given additional precipitation in Canada. Of course some regions may have different trends (a previous post has shown that the southern Ontario frequent intensities (i.e., 2-year return period) have decreased).

Where do design intensities, the statistics in IDF curves and tables, come from?

Annual maximum series (AMS) of recorded rain intensity are collected for duration intervals of 5 minutes to 24 hours.  These series are used to derive probability density functions to describe the frequency distribution of rainfall, and that can be used to determine specific 'return period' design intensities.  The return period is the inverse of the probability of a rainfall intensity (or volume) over a certain duration occurring during a given year.  So a 100-year intensity has a 1/100 or 1% chance of being exceeded each year, while a 2-year intensity has a 1/2 = 50% chance per year. Storm sewers are designed to convey 2, 5 to 10-year return period rain intensities - 5-year is most common.  Flooding, especially extreme flooding, occurs at higher return periods becoming more severe above the 25-year return period and increasing for 50 and 100-year intensities.

The recent version 3.10 update to IDF statistics analyzes rainfall data up to 2017.  These intensities can be compared to the version 2.00 datasets that included data up to 2007.  A total of 226 stations were analyzed to check for changes in intensity - this total includes about 72 stations that have been relocated, but by not more than 5 km from their previous location.  The same trends are apparent for all the exact match stations (92 stations) and stations with new IDs but unchanged coordinates (154 stations).

The following chart shows the ratio of new intensities to old intensities for these 226 stations, so 1.0 means no change in design intensities.

Extreme Rainfall Trends in Canada - Design Intensities by Duration and Return Period

What are the take-aways?

1) rainfall design intensities are generally unchanged over the past 10 years, considering 3313 station-years of additional data,

2) extreme rainfall intensities, the 100-year rates (red markers in the chart), have decreased - the shortest duration intensity governing urban flood risk has dropped the most,

3) short duration intensities that govern sewver design, 5-year return period intensities (purple markers) over 5-minute to 2 hour durations are unchanged on average,

4) 2-year intensities (green markers), the low intensity rainfall that is exceeded in 50% of years, has increased slightly - these intensities do not govern infrastructure design and are unrelated to urban flash flooding or flood damages.

Popular media has focused on theoretical changes in rainfall intensity, sometimes confusing those projections with actual changes in rainfall intensity that have been measured or observed.  See this review of recent CBC coverage in the Financial Post.  Increasing damage amounts are erroneously linked to changes in rainfall due to a changing climate.

If popular media were to focus on observed data, and actual trends in extreme rainfall statistics, like the trends reviewed above, it would have to temper claims of a new normal in extreme weather.  Data do not show increases the critical rainfall intensities - in fact, on average, extreme intensities have decreased.

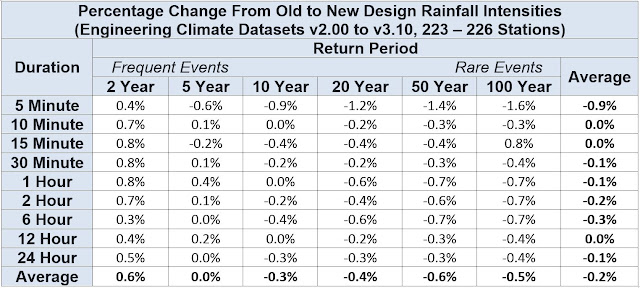
Changes in v2.00 to v3.10 dataset intensities are shown in the tables below.

Severe rainfall trends in Canada due to climate change
Extreme Rainfall Trends in Canada - Engineering Climate Datasets - IDF Curves


The analysis above is based on assessing the effect of adding additional data to the v2.00 IDF data intensities.  It is also possible to assess the effects of new data by splitting the series into old and new halves to compare IDF intensities and look for trends.  The following charts show the change in two long-period climate stations in the Toronto area.   Rainfall volumes are shown for a 24 hour period - intensities would be simply the volumes divided by 24 hours.

Toronto Pearson International Airport Climate Station - Changes in 24 Hour Rainfall Frequencies

For the Toronto Pearson International Airport climate station, the return periods of the old period volumes (blue line) have shifted right in the new data set, meaning longer return periods for a given volume, i.e., lower frequency.

The chart also compares how a climate model has predicted return periods have changed from 1961 to 2010, covering approximately a similar period.  Those model frequency shifts were reported by the CBC (link: https://www.cbc.ca/news/technology/extreme-rainfall-climate-change-1.5595396) and considered a 1 degree warming scenario. The climate model predicts lower return periods for a given volume, meaning that volume occurs more frequently - that is not consistent with observed local data at this station that has shown significantly longer return periods in the new period.

Toronto City Climate Station - Changes in 24 Hour Rainfall Frequencies

For the Toronto City (downtown) climate station, the return periods of the old period volumes (blue line) have shifted slightly right in the new data set, meaning slightly longer return periods for a given volume, i.e., slightly lower frequency.

The chart again compares climate model return periods for 1961 to 2010.  Again, the model, which represent a large area, and not necessarily the specifics of the Toronto area predicts lower return periods for a given volume, meaning that volume occurs more frequently - that is not consistent with observed local data at this station that has shown no significant change.

It is possible to look at the change in intensity as opposed to the change in frequency.  The following chart for Toronto Pearson International Airport climate station presents the same data but expresses the changes in terms of intensity, as opposed to frequency.

Toronto Pearson International Airport Climate Station - Changes in 24 Hour Rainfall Volumes
Often you can read in media reports that both the frequency and intensity increased over time - this is a peculiar way to express changes as that data can be used to show a change in one or the other but realistically not both at the same time.  To show the change in frequency and the change in intensity would mean allocating the change in some proportion to the two.

***

Do we have enough weather stations to analyze trends in observations - yes! - we are getting more and more stations and data over time - see previous post regarding additional Environment Canada stations since 1990.

In addition, municipalities are adding 100's of stations to support local studies as described in another post. More rain intensity data than ever before.

Although the data shows less extreme rainfall in Canada, some confuse models that predict future conditions and measured data.  The CBC misinterpreted a model predicting that 50 year storms would happen every 35 years in a time period out to 2015, and reported that this projections has already happened - read more about that here.

Do We have Enough Climate Stations in Canada To Track Trends in Extreme Rainfall?

Some have suggested that we have lost so many climate stations due to cut backs in the 1990's that we can't accurately detect trends in extreme rainfall.  But many are confusing manual climate stations with the stations that collect rainfall intensity data, often automatically.  The number of stations measuring extreme rainfall has been increasing since 1990.

Declining number of stations was noted in the ECO's report 2018 GREENHOUSE GAS PROGRESS REPORT CLIMATE ACTION IN ONTARIO: WHAT'S NEXT? - (see Appendix D)
https://docs.assets.eco.on.ca/reports/climate-change/2018/Climate-Action-in-Ontario.pdf

CBC New has also referred to this concept in responding to a complaint to the CBC Ombudsman regarding accuracy in reporting on extreme weather trends.  What has been cited as evidence of that decline is the chart in Appendix D in the ECO report above. CBC's Director of Journalistic Standards Paul Hambleton wrote:

"The report suggests several possible reasons for this inconsistency, including issues with data collection: There simply are not enough rain gauges. Rainfall data is collected using rain gauge buckets that can record both amount and intensity of rainfall. After a series of federal budget cuts in the 1990s, there are fewer rain gauge stations across the country than there were 60 years ago."

Fewer rain gauge stations? Or fewer "manual" rain gauge stations?  Yes there is a difference.

What does that chart show?  It summarizes declining manual stations in Canada and is a excerpt from the paper in Atmosphere-ocean An Overview of Surface-Based Precipitation Observations at Environment and Climate Change Canada (Mekis et al., 2018) - https://www.researchgate.net/publication/324041502_An_Overview_of_Surface-Based_Precipitation_Observations_at_Environment_and_Climate_Change_Canada

The chart of manual station count in Canada is Figure 2a in the paper on the left below.
Number of Manual Climate Stations in Canada

This chart has been referred to in discussions on extreme rainfall trends.  For example, in the ECO report this chart has been related to intensity-duration-frequency of isolated localized storms as in the excerpt at right:

Readers of this blog will have seen extensive analysis of the trends in extreme rainfall across Canada, including annual maximum series and intensity-duration-frequency (IDF) trends.  The data used is that of Environment and Climate Change Canada, distributed in the Engineering Climate Datasets.

What do Engineering Climate Datasets show us in terms of number of stations that collect and analyze extreme rainfall and IDF trends - they have been increasing!  And the number of station-years of data has been increasing - that means more long-term data to support more reliable statistical analysis.  Good news. The following table summarizes the trends:

Rainfall Intensity Data in Canada
Number of Climate Stations in Canada With Rainfall Intensity Analysis

The newer datasets include more stations, a 22% increase in station count since 1990. And the number of station-years has increased by 48% since 1990 - that's almost 50% more data to analyze and derive IDF design curves since I graduated and started working in this field.

How have the number of stations with extreme rainfall analysis, increasing since 1990, compared to the number of manual stations decreasing since 1990? See chart below:

Climate stations in Canada - trends, count, type
Number of Climate Stations in Canada - Manual and Intensity-Duration-Frequency Stations.  Manual stations decreasing while IDF stations and number of station-years of data increasing. (note: v2.00 (557 stations) and v3.00 (596 stations) not shown on chart)

The Mekis et al. figure is shown in blue and the IDF station trends in orange. Obviously the decline in manual stations does not relate at all to the trends in IDF stations.  As noted in other blog posts, municipal IDF stations have also proliferated over past decades, complementing the IDF stations charted above.

So when CBC's Paul Hambleton writes: "After a series of federal budget cuts in the 1990s, there are fewer rain gauge stations across the country than there were 60 years ago" he missed an important detail - yes manual stations that are expensive to operate have declined, as we expect.  It makes sense that we have fewer manual climate stations since 1990. 
Technology changes.  A good summary of the changes in equipment is described by Mekis et al. - image above are from the website https://www.wikiwand.com/en/Rain_gauge that describes the history of rain gauges and their evolution.

But what about automated weather stations? And what about the number of stations used to collect extreme rainfall information and rainfall intensities? Has the number of stations that define extreme rainfall decreased since 1990? No.

IDF stations have increased from 532 to 651 stations since 1990, many with longer periods of record - we have more extreme weather data to rely on today!  The CBC and others should clearly be more careful when interpreting data on climate station and extreme rainfall  monitoring.  

Southern Ontario Extreme Rainfall Trends - Environment Canada Engineering Climate Datasets IDF Tables

Environment Canada's version 3.10 update to Canada's rainfall IDF tables and curves shows more increases than decreases and slightly more significant increases than decreases - overall trends were shown in a recent post: https://www.cityfloodmap.com/2020/05/annual-maximum-rainfall-trends-in.html.

Regional trends may be up or down and warrant further review.  In Southern Ontario the IDF intensities for long term stations have been reviewed and compared with pre-version 1.00 statistics up to 1990 (similar to version 3.00 and version 2.30 comparisons shared in earlier posts).  The following table shows average changes since 1990, and the surrounding arrows suggest how these changes may influence infrastructure design, if at all.

Southern Ontario IDF Rainfall Intensity Trend Table - Environment and Climate Change Canada's Engineering Climate Datasets, Pre-Version 1.00 (up to 1990) to Version 3.10 (up to  2017)

The 21 stations assessed include:  Sarnia Airport, Chatham WPCP, Delhi CS, Port Colborne, Ridgetown RCS, St Catharines Airport, St Thomas WPCP, Windsor Airport, Brantford MOE, Fergus Shand Dam, Guelph Turfgras CS, London CS, Mount Forest (Aut), Stratford WWTP, Waterloo Wellington Airport, Bowmanville Mostert, Hamilton Airport, Hamilton RBG CS, Oshawa WPCP, Toronto City, Toronto International Airport (Pearson).

The above changes in design rainfall intensities since 1990 do not suggest any overall shift that would affect how municipal drainage infrastructure would be designed considering current weather conditions.  That is, overall intensities have decreased by 0.2% which in negligible.  The 5-minute, 2-hour and 6-hour intensities decreased consistently across all return periods.  The change however is also negligible.  On average frequent intensities, e.g., 2-year intensities expected every couple of years, and 5-year intensities, used for storm sewer design showed overall decreases.  Again the changes are negligible.  The 100-year intensities increased by 0.1% overall which is also negligible, especially considering the confidence limits with such statistics and the uncertainty in curve fitting (Gumbel distributions are used, other distributions would provide shifts in results).  One would expect rare intensities to increase over time for skewed distributions given sampling bias with short records (i.e., limited observations of extreme events are expected to lead to underestimates of 100-year statistics).

Of course considerations must be made to account for future changes and uncertainties.  Some cities and regions have incorporated allowance for climate change effects.  In Quebec a 18% allowance is standardized.  Some cities (e.g., Ottawa) include a 20% stress test to evaluate any unacceptable conditions that warrant design changes to address future potential risks.  Others incorporate stress test hyetographs in the design process - the Windsor/Essex Ontario standards include a stress test event that has 39% greater volume than the standard 100-year design storm (NB - the daily volume is increased to account for that additional volume distributed uniformly across 24 hours, while peak hyetograph intensities are only nominally affected). 

The chart below shows the IDF trends at these long-term record Southern Ontario stations.

Southern Ontario IDF Rainfall Intensity Trend Chart by Duration - Environment and Climate Change Canada's Engineering Climate Datasets, Pre-Version 1.00 (up to 1990) to Version 3.10 (up to  2017)

It is clear that that the short duration intensities (red and orange bars representing 5 and 10 minute durations) have decreased the most as shown in the table above. The chart and table below shows a more simplified version of the above chart indicating the range of changes observed.

Southern Ontario IDF Rainfall Intensity Trend Chart by Duration - Environment and Climate Change Canada's Engineering Climate Datasets, Pre-Version 1.00 (up to 1990) to Version 3.10 (up to  2017)

The above chart shows that 2-year and 5-year IDF rainfall intensities have decreased most consistently among all stations.  Those intensity estimates benefit from many observations each year to determine the statistics.  Rare event intensities from 25-year to 100-year return periods have more equal increases and decreases yet the decreases are greater.  The magnitude of the changes, both increases and decreases are on average negligible.  Even the greatest increase of 1.2% from 1990 to 2017 (27 years) is negligible for the purpose of hydrologic analysis and drainage infrastructure design.


Toronto Area Extreme Rainfall Intensity Trends - Environment Canada IDF Curve Updates 2020

Environment and Climate Change Canada's intensity duration frequency (IDF) data describes the rare extreme rainfall intensities used to design drainage infrastructure and to assess river peak flows/flood flows when the big storms hit.

Some climate station IDF analysis have been due for an update for several years.  The new version 3.10 update in 2020 extends analysis to 2016-2017 in many cases.  The trends in short duration intensities can show how flood risks are changing due to changing climate and any more severe weather. Many municipalities and researchers have updated their IDF statistics internally and have reported trends in extreme rainfall intensities (see previous post for Ontario studies: https://www.cityfloodmap.com/2020/05/annual-maximum-rainfall-trends-in.html).

Earlier versions of the IDF datasets are available to characterize annual maximum rainfall, dating back to 1990.  The tables below shows updated trends in 100-year rainfall intensity over a short 5 minute duration at Buttonville Airport in Markham (updated in version 3.10 in 2020) and in Toronto and Mississauga (updated in version 3.10 in 2019).


For short durations, it appears that extreme rainfall intensities are decreasing in the Greater Toronto Area.  The rare 100-year intensities are decreasing from 4-7% at the three locations above.  The more frequent 2-year intensities are decreasing by about 5-8%.

There is higher uncertainty with 100-year storm intensities due the rarity and spatial distribution of events.  However, the more frequent 2-year intensities that rely on many more rainfall observations every year to characterize these average annual peaks are more reliable.  To illustrate this, consider the 95% confidence bands on the Environment Canada IDF 5-minute data for Buttonville Airport, in southern York Region, just north of Toronto:
Extreme Rain 95% Confidence Bands Buttonville Airport, Markham, Ontario - Environment Canada Engineering Climate Datasets v3.10
The 100-year 95% confidence band of 97 mm/hr (2 x 48.5) is 46% of the expected value of 210.8 mm/hr.  In contrast, the 2-year band of 22.6 mm/hr is only 22% of the expected value of 104.7 mm/hr, a relatively tighter band.  The tight band makes the observed decrease in 2-year rain intensities more noteworthy, i.e., the 2-year intensity has decreased 7.6% which is a significant proportion of the uncertainty band.

The longer duration annual maximum rainfall series for Toronto and Mississauga have relatively tighter confidence bands for both 100-year and 2-year intensities:

Extreme Rain 95% Confidence Bands Pearson International Airport, Mississauga, Ontario - Environment Canada Engineering Climate Datasets v3.10

Extreme Rain 95% Confidence Bands Toronto, Ontario - Environment Canada Engineering Climate Datasets v3.10

Given that rainfall intensities are decreasing over most durations in the Greater Toronto Area, based on Environment Canada's annual maximum series and derived 2-year and 100-year IDF design intensities, why does media often report a 'new normal' of more extreme weather?  This may be due to lack of familiarity with data and a tendency to exercise an 'availability bias', i.e., simple listing of recent events that have caused damages and association of those events with increasing rainfall intensities, but without checking the actual rainfall trends or investigating other factors.  For more on cognitive biases in framing and solving complex problems read about Thinking Fast and Slow on Floods and Flow:   https://www.chijournal.org/C449.   Given the proliferation of rainfall gauges across the GTA, many more than the Environment Canada numbers, the observation of many extreme events over a short duration may not be a statistical anomaly at all, as analysis here shows: https://www.cityfloodmap.com/2019/03/are-six-100-year-storms-across-gta-rare.html

The CBC has made several corrections to its stories on changing extreme rainfall trends in the past, sometimes finding violation of its Journalistic Standards and Practices regarding accuracy of reporting - here are some examples: https://www.cityfloodmap.com/2019/06/cbc-correcting-claims-on-extreme.html.  Most recently the CBC Ombudsman in a review entitled "Past, Present, or Future" wrote that "journalists could have been clearer with their choice of tenses" - more on that here: 

The CBC Ombudsman stated "There are appropriate distinctions made between observed phenomena and predicted phenomena" in its reporting noting this excerpt: 
  • Precipitation will increase in much of the country.
  • Weather extremes will intensify.
The last two bullet points are careful to use the future tense.

The recently updated Environment Canada IDF data in the GTA supports the CBC's perspective that intensified weather extremes are predicted phenomena as opposed to observed ones.


Southern Ontario Observed Rainfall Intensities Decreasing - Annual Maximum Values Lower In Environment and Climate Change Canada's Engineering Climate Datasets (Version 3.0)

Ontario extreme rainfall annual maximum design intensity IDF trends climate change
Long term southern Ontario observed maximum rainfall trends,
according to Environment and Climate Change Canada's Version 3.0
Engineering Climate Datasets - decreasing trends in rain intensity and
more significant decreases than increases. 
Good news! Rainfall intensities have been decreasing in Ontario, Canada's most-populated province according to newly-released data. Less intense rain means lower urban flooding risk, contrary to many media reports that have confused future predictions of more extreme weather as a climate change effect with actual observed changes in the past. 

Maximum annual rainfall amounts over short durations at Ontario climate stations are used to derive engineering design intensities used in design of infrastructure such as sewers, culverts, channels, and ponds - the things that help convey rainfall runoff safety away from otherwise vulnerable people and property.

Environment and Climate Change Canada (ECCC) has recently updated its Engineering Climate Datasets that include a statistical analysis of observed trends in maximum values observed each year. The newest data are identified as Version 3.0 and are available as part of the Intensity-Duration-Frequency (IDF) Files on the ECCC website:
http://climate.weather.gc.ca/prods_servs/engineering_e.html

The previous Version 2.3 datasets showed decreasing annual maximum values at 21 southern Ontario climate stations with at least 30 years of observations - see previous post.

The updated Version 3.0 datasets continue this decreasing trend, showing that at the same 21 climate stations with an average observation period of 47 years:

  1. There are 42% more decreasing trends than increasing ones across all durations and stations (55.6% decreasing trends vs. 39.2% increasing ones).
  2. There are 75% more statistically significant decreases than increases (7 significant decreases vs. 4 significant increases).
This table shows the station name, ID, trends for each duration of 5 minutes to 24 hours, as well as the length of record and the most recent year in the Version 3.0 dataset.

Ontario Severe Rainfall Trends Climate Change Effects on Extreme Weather
Southern Ontario Observed Maximum Rainfall Trends - Environment and Climate Change Canada
Engineering Climate Datasets - Version 3.0
Trend Direction and Significance for 21 Climate Stations with Long Period Records (Greater than 30 Years)


Other observations:

  1. There are no statistically significant increases for durations less than 6 hours - that means the short duration convective storms burst that can lead to urban flooding related to most infrastructure systems do not show any appreciable increases.
  2. Overall downward trends are contrary to insurance industry statements, particularly the disproved "Telling the Weather Story" claim that there has been a one standard deviation increase in the probability of extreme rainfall according to Environment Canada data (the "Story" was only a theory/concept incorrectly cited and widely misreported as real data).
  3. Overall downward trends are contrary to many media reports citing a new normal of wild weather. Fortunately, some media, lead by the the Financial Post's Terence Corcoran are engaged in a critical review of urban flood drivers including extreme rainfall and the means to mitigate flood damages:
  4. CBC staff and the CBC Radio Canada Ombudsman have helped focus on facts Environment and Climate Change Canada data and corrected many stories on increasing storm frequency or intensity as noted here:
  5. Analysis by the School of Engineering at the University of Guelph, published in the International Journal of Environmental Research in 2015, looked at monthly trends and suggested that "The decrease in August extremes seems to have a significant impact on the annual extremes in the southwest and southeast regions": https://drive.google.com/file/d/1AngUYFFlm-RqQlmSC0gZqxy8nV61BW8J/view

Urban flooding is certainly an important issue to be addressed. And there are many factors that affect today's flood risks as explored in a previous post. While the insurance industry has suggested a link between increasing flood damages to increasing rain extremes due to climate change, given the wealth of evidence pointing to other quantifiable factors like increasing hydrologic and hydraulic stresses - and no change in rainfall extremes! - means that there is not even a correlation much less a causation relationship between flood damage and rain extreme trends (i.e., damages are up but rain intensities are down). This was pointed out in my Financial Post OpEd

Effective flood mitigation strategies must recognize the intrinsic capacity limitations in the vast amount of legacy infrastructure built over 30 years ago, and focus on reducing risks by addressing any level of service gaps through adaptation. Cost-effective and timely methods can include increasing the conveyance capacity of grey infrastructure, as opposed to mitigating rain/weather stresses that have not appeared to change, based on official, national engineering datasets. While such infrastructure investments should consider potential future climate effects, and we have many examples of analyzing stormwater and wastewater systems for such effects, past trends do not point to an increase to date in rainfall extremes. As a result, derived intensity duration frequency values for the stations reviewed above, based on values in the Version 3.0 datasets, shows an overall decrease in design intensities for small frequent and large rare storms across southern Ontario - those results were presented in a previous post, as shown below:

Ontario extreme rain IDF trends
Ontario Intensity Duration Frequency (IDF) Trends - 2 Year to 100 Year for all Durations
Environment and Climate Change Canada Engineering Climate Datasets - Version 3.0

Recognizing trends in observed rainfall maximum values and the derived design intensities will support data-driven, evidence-based policies and programs for achieving flood resilience through strategic infrastructure investments.

***

The following table explores annual maximum values at Ontario climate stations with over 50 years of record:
Ontario Extreme Rainfall Severe Weather Storm Trends
Ontario Observed Maximum Rainfall Trends - Environment and Climate Change Canada
Engineering Climate Datasets - Version 3.0
Trend Direction and Significance for 11 Climate Stations with Long Period Records (Greater than 50 Years)

The table expands into higher latitude eastern Ontario communities including Kingston and Ottawa as well as to northern Ontario. The eastern Ontario climate stations show an overall consistent trend in decreasing observed rainfall maxima over the shortest durations. Another eastern Ontario station, the Ottawa Airport also shows decreasing trends over short durations, including several statistically significant decreases (i.e., lower observed rainfall intensities) for durations of 10 minutes, 15 minutes and 1 hour.

Previous analysis of the Version 2.3 datasets showed the differences in southern and northern Ontario trends. Increases in intensities in the north, beyond Ontario's largest urban centres, could reflect a shift toward more rainfall events instead of snowfall as a result of warming temperatures.