Showing posts with label Low Impact Development. Show all posts

Green Infrastructure, Low Impact Development (LID) Construction Costs

A costing tool was developed to assess the capital and operation and maintenance costs of infrastructure used to control CSO's by Capital Region Water, a municipal authority that improves, maintains, and operates the greater Harrisburg, Pennsylvania USA area’s water system and infrastructure.

Unit cost data for various green infrastructure, or Low Impact Development (LID) stormwater management practices, are provided in Capital Region Water's costing tool and it's reference Appendix B - Basis of Cost Opinions, Combined Sewer Overflow Control Alternatives, Costing Tool Reference Manual, Updated 2017 (https://pdf4pro.com/cdn/appendix-b-basis-of-cost-opinions-capital-6c71f.pdf).

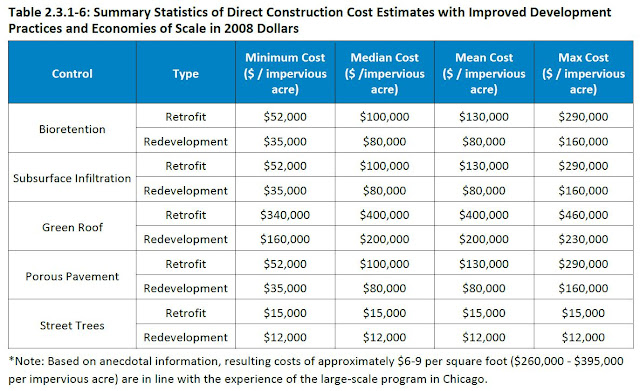
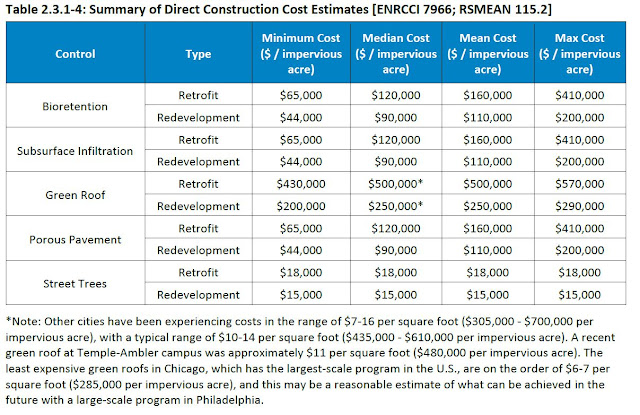
The following tables illustrate 2008 unit costs per impervious acre. The first considers costs with limited cost efficiencies or savings over current costs.  The second table considers that cost reductions can be achieved under widespread implementation with economies of scale.
green infrastructure bioretention infiltration porous pavement green roof street trees capital construction cost
Green Infrastructure Costs in Retrofit and Redevelopment Settings - Bioretention, Subsurface Infiltration, Green Roof, Porous Pavement, and Street Trees - 2008 Dollars, Harrisburg, PA, USA
low impact development LID bioretention infiltration porous pavement green roof street trees capital construction cost
Reduced Green Infrastructure Costs in Retrofit and Redevelopment Settings  With Assumed Economies of Scale - Bioretention, Subsurface Infiltration, Green Roof, Porous Pavement, and Street Trees - 2008 Dollars, Harrisburg, PA, USA

The unit costs above, excluding green roofs and streets trees, result in a mean cost of $160,000 per impervious acre for retrofits and $110,000 for redevelopment.  This equates to mean costs of $395,000 and $272,000 per impervious hectare.

Adjusting costs to 2020, based on the Statistics Canada Infrastructure Construction Price Index, increases 2008 costs by 30%. The following table presents 2020 estimated unit costs per impervious hectare.

Summary Statistics of Direct Construction Cost Estimates in 2020* Dollars ($/impervious hectare)
Control Type Minimum Cost
($ / impervious hectare)
Median Cost
($ / impervious hectare)
Mean Cost
($ / impervious hectare)
Max Cost
($ / impervious hectare)
Bioretention Retrofit $209,000 $386,000 $514,000 $1,317,000
Redevelopment $142,000 $289,000 $354,000 $642,000
Subsurface Infiltration Retrofit $209,000 $386,000 $514,000 $1,317,000
Redevelopment $142,000 $289,000 $354,000 $642,000
Green Roof Retrofit $1,382,000 $1,607,000 $1,607,000 $1,830,000
Redevelopment $642,000 $803,000 $803,000 $932,000
Porous Pavement Retrofit $209,000 $386,000 $514,000 $1,317,000
Redevelopment $142,000 $289,000 $354,000 $642,000
Street Trees Retrofit $57,000 $57,000 $57,000 $57,000
Redevelopment $48,000 $48,000 $48,000 $48,000
Average Excl. Green Roof and Street Trees Retrofit $209,000 $386,000 $514,000 $1,317,000
Redevelopment $142,000 $289,000 $354,000 $642,000

* 2008 to 2020 adjustment estimated at +30% considering Infrastructure construction price index (+26.9% for 2010-2019)


The average retrofit cost for bioretention, subsurface infiltration and porous pavement is $514,000 per impervious hectare for retrofits and $354,000 per impervious hectare for redevelopment.  Lower costs with expected cost efficiencies are estimated below, adjusting 2008 cost to 2020 (i.e., increase by 30%).

Summary Statistics of Direct Construction Cost Estimates with Improved Development Practices and Economies of Scale in 2020 Dollars ($/impervious hectare)
Control Type Minimum Cost
($ / impervious hectare)
Median Cost
($ / impervious hectare)
Mean Cost
($ / impervious hectare)
Max Cost
($ / impervious hectare)
Bioretention Retrofit $166,000 $321,000 $417,000 $932,000
Redevelopment $112,000 $257,000 $257,000 $514,000
Subsurface Infiltration Retrofit $166,000 $321,000 $417,000 $932,000
Redevelopment $112,000 $257,000 $257,000 $514,000
Green Roof Retrofit $1,092,000 $1,284,000 $1,284,000 $1,478,000
Redevelopment $514,000 $642,000 $642,000 $738,000
Porous Pavement Retrofit $166,000 $321,000 $417,000 $932,000
Redevelopment $112,000 $257,000 $257,000 $514,000
Street Trees Retrofit $48,000 $48,000 $48,000 $48,000
Redevelopment $39,000 $39,000 $39,000 $39,000
Average Excl. Green Roof and Street Trees Retrofit $166,000 $321,000 $417,000 $932,000
Redevelopment $112,000 $257,000 $257,000 $514,000
The retrofit and redevelopment costs of $417,000 to $257,000 per impervious hectare would be equivalent to costs of $834,000 to $514,000 per hectare, assuming 50% impervious coverage.  These costs are of similar magnitude to average Ontario and Alberta LID project costs presented in an earlier post (see update at the bottom of the post https://www.cityfloodmap.com/2019/10/green-infrastructure-cost-ontario.html). Compiled LID project costs indicate an average area-weighted cost of $540,000 per hectare, including several recent project costs that have not yet been adjusted, i.e., increased, to today's 2020 dollars.

While project costs are expected to vary from site to site, average unit costs may be used for planning purposes, when evaluating the cost to retrofit large areas, e.g., sewer catchments or tributary subwatersheds where stormwater management controls are being evaluated.

***

Notes: while economies of scale have been assumed with widespread implementation, trends in unit costs in Philadelphia had not yet revealed decreasing unit costs as indicated in an earlier post (https://www.cityfloodmap.com/2018/07/green-infrastructure-capital-and.html) and as shown in the chart below:

Green Infrastructure Low Impact Development LID GSI Capital Cost Trend
Green Infrastructure / Low Impact Development Capital Cost Trend - Philadelphia Clean Waters Pilot Program


Low Impact Development Capital Costs - City of Philadelphia 2018 Annual Report Compiles Green Infrastructure Costs and Service Area

See September 2019 Update and Comparison at Bottom of this Post.

Green Infrastructure (GI), Low Impact Development (LID) Stormwater Best Management Practice (BMP) measures are widely promoted to achieve water management goals including baseflow management (i.e, through groundwater infiltration / recharge) and erosion stress reduction (i.e., through runoff volume reduction for small storms).

The capital cost of GI / LID / BMPs is of considerable interest to those considering implementation on a system-wide basis. In general, the capital cost can be related to the size of the measure, often dictated by the size drainage area it serves.

The City of Philadelphia has been implementing GI / LID / BMP retrofits for many years and has compiled the cost of measures. These have been recently reported in this document (see pdf page 151). This is an excerpt:


Data in the table has been compiled to support cost benefit analysis for flood resiliency assessments. The chart below shows how costs increase as a function of drainage area size.


The slope of the cost vs. drainage area trend line is $295,000 per acre, or $728,000 per hectare considering 85 projects, some with multiple sub-projects.

The 2018 report includes projects completed between 2006 and 2018. When capital costs are adjusted for changes in construction costs, costs can be expressed in 2018 dollars. An adjustment in Philadelphia project costs was based on data from RSMeans (link). The following chart shows green infrastructure capital costs in 2018 dollars vs. drainage area.

 The average cost per acre is $320,000 while the cost per hectare is $792,000. There is a very strong correlation of cost with drainage area serviced by the green infrastructure feature. Weighted by the overall program cost of $56.8M and total drainage area of 164 acres (66 hectares), the program costs per acre and hectare $347,000 and $857,000 respectively. In a previous post the budgeting considered by Philadelphia was $350,000 per impervious acre, or $865,000 per impervious hectare. These costs suggest a lower cost per impervious area than those budget amounts.

The cost of providing storage is indicated in the chart below. Again the overall project or bundled project cost is highly correlated to the storage volume provided by the green infrastructure measures. The average cost is $52.7 per cubic foot or $1850 per cubic metre of storage. Note that the weighted overall program cost is different - the $56.8M cost for 907,000 cubic feet, or 25,700 cubic metres, of storage works out to unit costs of $62.6/cu.ft, or $2200/cu.m
It is worthwhile noting the average storage depth across the drainage areas serviced by the green infrastructure features. The average depth is 25,700 cu.m / 66 hectares = 25,700 / 660,000 = 39 mm. This reflects the range in design of 1 to 2 inches (25-50 mm) intended for CSO control. It is above the depth that is typically used for achieving watershed or catchment water management goals, e.g., water balance management for erosion mitigation, groundwater recharge, or non-point source water quality management. The draft Ministry of Environment, Conservation and Parks Low Impact Development guidance manual proposed control volumes up to 32 mm in Ontario, or 18% below the average depth in the Philadelphia projects.

Unit costs can be used to support high level green infrastructure program and project budgeting. There is scatter within the charts for a given drainage area or storage volume, meaning the cost of an individual project should allow for a high contingency above the average unit costs, until design details are available.

Unit costs can be assessed for various LID types - cost per drainage area for permeable pavement, rain garden, infiltration trench and tree trench projects are shown in the chart below with infiltration trenches having the lowest cost per acre and permeable pavement having the highest. The unit costs of rain gardens and tree trenches are above those of infiltration trenches.


Cost per storage volume for permeable pavement, rain garden, infiltration trench and tree trench projects are shown in the chart below. Again, infiltration trenches having the lowest cost per cubic foot of storage and permeable pavement having the highest cost per storage unit. The unit costs of rain gardens and tree trenches are above those of infiltration trenches.


The inset text boxes on the charts illustrate unit costs (i.e., the slopes of the trend lines):

Unit Cost per Drainage Area Summary:
Infiltration Trench: $260k/acre ($642k/hectare)
Pervious Pavement: $594k/acre ($1.47M/hectare)
Rain Garden: $408k/acre ($1.01M/hectare)
Tree Trench: $318k/acre ($790k/hectare)

Unit Cost per Storage Volume Summary:
Infiltration Trench: $49.0/cf ($1730/cu.m)
Pervious Pavement: $97.2/cf ($3430/cu.m)
Rain Garden: $60.1/cf ($2120/cu.m)
Tree Trench: $58.9/cf ($2080/cu.m)

***

Green Infrastructure Strategies?

In Ontario, there are approximately 852,000 urban hectares that have no green infrastructure controls  in the year 2000 (per SOLRIS GIS land use data). Implementing green infrastructure across all these areas, similar to Philadelphia, would cost 853,000 x $857,000 = $730 billion - this is 100 times greater than the entire Ontario stormwater infrastructure deficit, and a similar magnitude to Ontario's annual GDP ($854B in 2018). Philadelphia is targeting a specific need for CSO control to justify its green infrastructure investment. Given this magnitude of cost, to make green infrastructure affordable in Ontario certainly requires a strategic assessment on where it is implemented. The expected annual flood damage loss in Ontario is $292M, meaning that if flood control green infrastructure reduces the cost by half each year for 50 years (assumed service life), the total savings is $7.3B - why would one invest 100 times that loss ($730B) in green infrastructure?

Ontario's Draft LID (Low Impact Development) Manual sets a generic goal of implementing LID / green infrastructure in new development and retrofit development (including linear infrastructure). Cost concerns with a generic approach have been identified by the Ontario Society of Professional Engineers in comments on Bill 139 assuming unit cost of $400,000 per hectare based on a small set of Ontario tender costs. Those costs were for small volume installations, whereas the Philadelphia program costs are for high volume installations.

***

Update September 2019

The following is a comparison of costs from three sources:
i) Philadelphia (costs above),
ii) Ontario and Alberta project review (expanding previous list), and NEW
iii) EPA International BMP Database costs review.

Green Infrastructure Costs - Philadelphia, Ontario, Alberta and US EPA BMP Database Projects
Costs are normalized by drainage area and grouped by type of LID BMP.  An important design parameter is shown in the second last row - i.e., storage volume - that helps explain the variability in some program costs.  For example, Philadelphia storage volumes average 38.9 mm across the catchment being served while the EPA database projects average 6.6 mm - Philadelphia is pursuing CSO control with target storage volumes of 1-2 inches.  Other EPA BMP Database projects incorporate much smaller storage volumes on average.  Note that Philadelphia has a high cost per hectare but this is due to a higher design volume - their cost/hectare is 4.1 times the EPA project cost, but the design volume is 5.9 times greater.  This shows a higher cost efficiency in Philadelphia for the larger projects.  This is seen in the cost per ha-mm or cost per cubic metre of storage (only $22,000 / ha-mm for Philadelphia vs. $32,000 per ha-mm for EPA projects).

Some more notes:
- the Ontario costs in bold are for entire projects what may include several components, which is why the individual LID type costs are lower
- Ontario data omits storage for most projects, which is a gap that should be filled in the future
- the costs per storage volume in EPA for permeable pavement and infiltration trenches seem low, based on large storage projects that suggest costs of $400-500 / cu.m for large centralized facilities

How can the unit costs for LIDs be applied, say in planning level studies?  Well ...

In Ontario, 5 mm is a general criterion for erosion control (Toronto and Region Conservation Authority watershed) and is the control volume for Toronto's Wet Weather Flow Management Program.  The compiled costs can be used to show that providing this 5 mm of storage would cost $160,000 per  hectare ($32,000/ha-mm x 5 mm).

In a typical storm sewer catchment with a 50 hectare drainage area the capital cost would be $8M to implement 5 mm LID storage across the catchment/drainage area.

Across Ontario, with 852,000 hectares of urban development built before 2000, the cost to implement 5 mm of LID storage would be $136B, or about 20 times Ontario's current stormwater infrastructure deficit.

Do Baseflow Impacts of Urbanization Warrant Green Infrastructure Retrofits to Restore Water Balance?

Green infrastructure, low impact development practices (LIDs), also called stormwater management best management practices (SWM BMPs), are often proposed to restore water balance functions and mitigate impacts or urbanization on runoff and recharge. One argument is that baseflows are lowered due to reduced infiltration and discharges to watercourses. It is a simple textbook theory.

What does the data show on baseflow impacts? The following slide presentation was prepared to respond to the Ontario draft LID guidance manual in early 2017 since water balance impacts have been cited as justification for green infrastructure LIDs.


Local studies show that baseflows have increased over decades of urbanization, calling into question the need for such measures considering that potential impact has not materialized. As noted in TRCA's Approved Updated Assessment Report under the Clean Water Act, at most gauges there was an upward trend in baseflows which prompted this statement: "These overall increases to baseflow volumes are contrary to the common thought that increased impervious cover leads to reduced baseflow" - so for those keeping score, data - one, common thought - zero. (see page 3-40 at link to full report - disregard old link in the slide deck thx!).

TMIG also analyzed baseflows in the GTA and noted “The seven-day average consecutive low flow data provides an indication of the observed baseflows within a watercourse, and hence is a suitable measure for determining whether baseflow trends exist in an urbanizing area. The trend analysis identified noticeable baseflow trends in 13 of the 24 recording stations. Of these eight urban and two rural stations exhibited an upward trend, suggesting increasing baseflow.” (link to full report).

It would appear that baseflow stresses due to urbanization, i.e., development within the GTA, do not support the need for green infrastructure implementation to restore water balance functions.

Watershed-Scale Flood Damage Reduction Using LID BMPs - Does Green Infrastructure for New Development and Redevelopment Significantly Reduce Existing River Flood Risks

River Flood Loss Avoidance (Deferred Damages) with
Green Infrastructure / Low Impact Development BMPs
in New Development and Redevelopment in the US.
A study by Atkins for the U.S. EPA evaluates flood damage reduction across North America using Low Impact Development (LID) Stormwater Best Management Practices (BMPs). The 2015 report "Flood Loss Avoidance Benefits of Green Infrastructure (GI) for Stormwater Management" is available at this link and evaluates benefits of implementing LID BMPs in new development and redevelopment over 20 years.

Flood Losses Avoided in the Year 2040 for Various Zero Damage Thresholds
What is the value of estimated flood damage reduction from 2020 to 2040 by constructing GI / LIDs? Savings range from $63M to $136M per year in 2040, depending on whether river flood damages are assumed to start above 10 year events or more frequently above 5 year events.

Over the 20 year implementation period the deferred flood losses increase from $0 in 2020 to an average of $100 million (2011 dollars) for 5 and 10 year zero damage thresholds.

Deferred Flood Losses with LID BMP Implementation
for Stormwater Management in New Developments
After the first 10 year s of implementation the flood losses avoided averages approximately $50 million. The table to the right indicates the increase in flood reduction benefits over the green infrastructure implementation period.

Key question: is the losses avoidance significant and is there value in implementing green infrastructure to achieve river flood damage reduction?

To explore whether deferred damages are significant, lets compare the average loss reduction over the 20 year implementation with average losses in North America. Munich RE's NatCatService estimates losses in North America for meteorologic events and hydrological events. The chart at right shows that over the past 10 year from 2008 to 2017 the average losses per year we approximately $75 billion in 2017 dollars. (we could net out non-US areas like Canada to make this more apples to apples).

Munich RE Catastrophic and Relevant Event Overall Losses
Inflation Adjusted and Normalized 
The deferred flood losses over the 20 year period with LID implementation are $50 million in 2011 dollars - according to the Bureau of Labor Statistics consumer price index, the dollar experienced an average inflation rate of 1.42% per year. Therefore the annual LID loss reduction amount in 2017 is 8.8% higher than deferred losses in 2011, or $54 million (2017 USD).

Deferred annual flood losses of $54 million represents only 0.07 % out of $75 billion in overall annual losses. This suggests that near-term river flood damage reduction is not a core benefit of green infrastructure implementation.

The cost of expanded green infrastructure implementation is not assessed in the Atkins study as noted here:

"The costs of GI implementation are not included in this document. Nevertheless, new development and redevelopment already require stormwater management expenditures, either on-site or downstream; therefore, GI could be used to meet those requirements fully or partially for little or no
additional cost compared to overall construction costs. This study does not assume retrofitting of existing imperviousness. Retrofitting, in addition to implementation on new development and redevelopment, would be expected to generate more flood loss avoidance benefits but would incur
additional costs."

Given that green infrastructure stormwater controls are assumed to be included in the base cost of development or redevelopment, the micro-sized river flood loss reduction benefit comes at no addition cost, which could indicate good 'value' - however given the almost insignificant percentage of overall flood damages averted, one could question whether river flood risk reduction should be prescribed as a low impact development benefit at all. It would appear that core benefits of green infrastructure are instead the environmental ones related to water quality improvements and erosion risk reduction.

Today it is popular to promote green infrastructure citing its multi-faceted triple-bottom-line (TBL) benefits on many aspects of the environment. It would appear that riverine flood risk reduction is not one of those benefits to consider in the TBL assessment. Many groups and Canadian municipalities have noted impacts of green infrastructure on existing utilities and foundations as a dis-benefit / adverse impact of green infrastructure measures that typically infiltrate runoff into the ground. Many of these negative impacts were recently summarized in the Ontario Society of Professional Engineers' (OSPE) comments on Ontario's draft Watershed Planning Guidance which had promoted the role of green infrastructure for flood control :

https://drive.google.com/open?id=1dNFzxZxlzxUx-g9DzvVHSvwceXhddkCq

The OSPE comments note:

"While green infrastructure has recognized roles in achieving watershed outcomes, including
water balance and water quality management in greenfield developments, the above statement
is inconsistent with numerous studies that discount the flood-control benefits of green
infrastructure. Numerous studies have demonstrated that green infrastructure does not provide
a flood risk reduction benefit."

To support this statement, OSPE cited numerous Master Plans, Master Drainage Plans, Class Environmental Assessment studies, Best Practice documents, local university research, and municipality and water industry comments on the Ontario Ministry of the Environment and Climate Change's draft Low Impact Development guideline.

RJM


Are LIDs Financially Sustainable in Ontario? Philadelphia Green Infrastructure Costs - 1100 Low Impact Development Projects Define Implementation Funding for Long Term CSO & Water Quality Improvement - Comparison with 24 Ontario Projects

Philadelphia Green Stormwater Infrastructure Projects Map - Over 1100
Low Impact Development Projects for CSO Control
See September 2019 Update at Bottom of This Post

Philadelphia has an extensive green infrastructure retrofit program with cost information - recent Ontario low impact development project costs show comparable unit cost for implementation.

***

The City of Philadelphia implements green infrastructure (GI), aka low impact development (LID) best practices (BMPs), to control combined sewer overflows (CSOs).  Having implemented 1100 features in a retrofit setting, Philadelphia has a clear understanding of retrofit implementation costs. The following is a summary of their green infrastructure design construction costs provided by the city program staff:

City of Philadelphia Green Infrastructure / Low Impact Development Best Management Practices - Construction, Design and Planning Budgets Per Total and Impervious Area

Construction Cost
- $175,000 per acre ($432,000 per hectare)
Philadelphia Green Infrastructure Map by SWP / LID Type 
- $270,000 per impervious acre ($667,000 per hectare)

Design Cost
- Design fees typically 20-25% of construction costs

Total Cost (Design & Construction)
Philadelphia Green Infrastructure Map - Spatial Location
of Low Impact Development Measure
- Total costs of $230,000 per acre ($568,000 per hectare)
- Total costs of $350,000 per impervious acre ($865,000 per hectare)

Budgeting
-  $350,000 per impervious acre ($865,000 per hectare) is the overall target/budget cost that is achieved for the program and that does not include contingencies that could be carried for individual projects within the program.
- If estimated costs exceed $400,000 per acre ($988,000 per hectare) based on design estimates and project cannot be re-scoped, it is deemed too expensive and does not go ahead.

In Ontario, green infrastructure has been promoted for stormwater management in new developments since the Ministry of Environment's 1991 Interim Guidelines. Green infrastructure measures were promoted as part of a 'source control' approach and features that promoted infiltration were called Best Management Practices (BMPs). Since then, Ontario cities have developed design targets for achieving specific water resources management goals and have implemented LID BMP measures in appropriate locations. In the City of Markham and York Region, his history was summarized in a National Water and Wastewater Benchmarking Initiative Stormwater Task Force presentation:


The presentation above summarized LID implementation costs for nine (9) recent Ontario projects including bioswales, bioretention, infiltration galleries and permeable pavement. Theses cost are receiving close attention as LID implementation targets in some regions have been increased, e.g., through the Lake Simcoe Protection Act to meet environmental protection / phosphorus reduction goals, and as generic province-wide targets are now being evaluated by the Ministry of Environment and Climate Change.

Additional Ontario LID project implementation costs have been compiled with information shared by Ontario municipalities and also the Lake Simcoe Regional Conservation Authorit. This expands/updates the project costs in slide 17 of the above presentation. These costs include construction, design, administration and in-kind staffing efforts related to implementation of LID projects in the City of Markham (2 projects), City of Brampton (1 project) Town of Whitchurch-Stouffville (1 project), City of Ottawa (2 projects), Town of Ajax (1 project), City of Mississauga (3 projects), Town of Newmarket (2 projects), City of London (7 projects), Town of East Gwillimbury (1 project), Town of Uxbridge (1 project), Town of Aurora (1 project), Town of Innisfil (1 project).

The project costs and unit costs per total catchment are are shown below:

green infrastructure construction cost Ontario low impact development implementation cost retrofit
Ontario Green Infrastructure / Low Impact Development Best Management Practice Implementation Costs (No Adjustment for Inflation to 2018 Dollars) - Normalized Unit Costs Per Catchment Area Managed
This is a link to the above compiled Ontario LID costs (let me know if you have projects to add or can suggest edits / updates): Excel - Ontario Low Impact Development BMP / Green Infrastructure Implementation Cost Summary - 24 Projects

The average cost per hectare of $575,000 for these 24 projects is very close to the City of Philadelphia budget cost of $568,000. Cost per impervious hectare treated by the LID BMP would typically be higher (i.e., catchment is less that 100% impervious). Some notes regarding the project costs:

- complete costs are not available for some projects (e.g., Markham Green Road bioswale vegetation)
- one service area has been adjusted based on different sources (e.g., East Gwillimbury area reflect municipality's project brief and not original TRIECA 2017 presentation value).
- one projects has only tender cost estimate available, not actual construction cost (e.g., Newmarket Forest Glenn Rd)
- one project from LSRCA was not included in the list as it did not proceed to construction, but nonetheless incurred design and administration costs (e.g., City of Barrie, Annadale Recreation Centre, design/administration/geotechnical/in-kind staff cost of over $78,000) - this may reflect go/no go decisions on implementation that the others also consider
- most projects are retrofits, however some are new builds (Markham Green Road, Innisfil Fire Station)
- bioswales/enhanced swales require review given the wide range in unit costs per hectare of $51,000 (Uxbridge) to nearly $1.9M (Newmarket), with obvious sensitivity to the drainage area served

Previous cost estimates cited on this blog considered unit costs of approximately $400,000 per hectare and significant concern regarding the financial viability of any widespread implementation across Ontario's 852,000 urbanized hectares. Considering the expanded project cost review and adjusting for inflation, today's Ontario green infrastructure implementation costs can be estimated to be in the order of $600,000 per hectare. This magnitude of cost is comparable to Philadelphia's budgeting cost, considering over 1100 projects. These costs support the concern related to emerging Ontario policies that have not considered implementation cost impacts or financial viability.

The Ontario Society of Professional Engineers (OSPE) has recently highlighted concerns with the implementation of green infrastructure in Ontario in comments on Ontario's Long-Term Infrastructure Plan (my bold emphasis on the recommendations)

"....OSPE recommends that the Government of Ontario:

i. Critically apply the proposed ‘risk lens’ to infrastructure investments related to extreme
weather adaptation, recognizing variations in observed and predicted trends across the
province.

ii. Evaluate adaptation measures such as green infrastructure for stormwater management,
often cited as key mitigation measure, using the same ‘risk lens’ and consider the cost-
effectiveness of those infrastructure investments.

iii. Recognize that green infrastructure must be viewed through the same lens as
conventional infrastructure, adhering to established asset management principles and
full cost accounting—meaning it must be addressed up-front and directly, considering
system-wide costs."

OSPE has also commented on the limited role of green infrastructure for flood control and life cycle cost concerns in response to Ontario's draft Watershed Planning Guidance.

"Recommendation:

Green infrastructure LID implementation costs should be acknowledged to be potentially higher
than conventional grey infrastructure design, particularly for retrofits, and funding for additional
incremental retrofit costs should be considered in the comprehensive evaluation of alternative
management solutions beside green infrastructure and LIDs, including enhanced conventional
grey infrastructure designs with pollution prevention activities. Higher retrofit costs compared to
greenfield implementation should also be acknowledged.

Consideration for disproportionate costs should be acknowledged as a prohibitive constraint in
general and for linear development retrofits or widespread watershed implementation. A more
strategic approach to green infrastructure implementation, based on local needs and
considering local constraints (infiltration impacts and property flooding) is warranted."

"Recommendation:

The additional lifecycle cost associated with green infrastructure should be acknowledged to
support budgeting for long term operation, maintenance and depreciation.

The cost impacts of green infrastructure in existing communities should also be quantified
including costs in communities that are susceptible to infiltration stresses and sewer back-up
risks, additional treatment costs as infiltrated water is collected in foundation drains and
conveyed to treatment plants and cost of reduced service life of cast iron and ductile iron
watermains due to chloride infiltration in right-of-ways (i.e., accelerated corrosion). Such a
robust and holistic economic analysis can then support more strategic, financially sustainable
implementation policies for green infrastructure."

Let's work toward this sustainable implementation policies for all infrastructure - including green infrastructure - considering costs and strategic goals and specific performance outcomes. Low impact development implementation costs in the order of $600,000 per hectare, as shown through local and other jurisdictions, are simply not sustainable on a broad, system-wide basis.

RJM

***

September 2019 Update

Additional projects have been reviewed in Ontario and a couple have been added from Edmonton, Alberta.  The resulting average cost per hectare (area-weighted) is $581,000.  The following table presents a summary of cost per LID type (porous/permeable pavement, rain garden/bioletention, bioswale and infiltration/exfiltration).


The Ontario/Alberta costs now represent almost 8 hectares of catchment area, close to the EPA BMP database catchment area for projects with costs data (middle column).  Note that the Ontario/Alberta project costs may include several types of LID types in the treatment train.

Green Infrastructure Implementation Funding - Private Sector Costs Proposed as Offsets Paid by Benefiting Municipalities

How to fund green infrastructure and low impact
development stormwater management measures on
private property .... no easy answers. 
The report Economic Instruments to Facilitate Stormwater Management on Private Property is an interesting read, looking at how green infrastructure (GI) could be implemented and funded on private property to advance stormwater management goals. There is a link to the report.

The White Paper / study report explores the costs and benefits of green infrastructure, or low impact development (LID) measures, and looks at the barriers to implementation on private property - and there are many. These Barriers to the Implementation of LID Technologies include:

1. High up-front costs
2. Uncertain ongoing maintenance requriements
3. Low return on investment
4. Limited benefits accrue directly to property owners, yet they incur the high costs
5. High transaction costs

The report illustrates the types of costs and benefits under #4 in the following graphic:

Imbalance in public and private costs and benefits for green infrastructure / low impact development implementation.
The graphic illustrates that private costs are high, but the majority potential benefits are public.  Also, the private benefits are very low, like the potential reduction in stormwater management fees available to compensate for the GI or LID measures.

How high are the costs for implementing GI or LIDsfor improved stormwater management? Another interesting graphic shows annualized costs considering capital costs distributed over a 25 year service life (e.g., like annual depreciation of the asset) and annual operation and maintenance (O&M) cost.

LID capital and operation and maintenance costs greatly exceed the potential annual credit for stormwater fees. 
The report's impervious percentage of 20% seems too low
compared to typical urban development patterns in Ontario.
Typical residential percentages are double the report's
assumed value. Typical non-residential percentages can
even be higher (i.e., lots covered almost entirely by impermeable
roof top and parking lot surfaces.
The annual cost of LID measures averages about $5,000 per year considering a 'lot size' drainage area of 5000 square metres, or $10,000 per hectare. The cost estimates consider an area with 1000 square metres of impermeable area, meaning an impervious area percentage of 20% (i.e., very, very low for many urban areas ... meaning these average costs should be higher - see example impervious area coverage at right - while this is residential development, non-residential development has followed similar trends).

Given the disparity in costs and benefits, an obvious barrier to implementation of GI and LID on private property, what is proposed to incentivize implementation? Make someone else pay of course! Who pays? The Public Sector. They call this "OFFSETS" and explain it as follows:

"Offsets are payments offered to proponents of LID infrastructure in compensation
for costs incurred when significant benefits accrue to other parties. A principle of
equity or fairness underlies this type of compensation based on the argument that
costs should be borne proportionately by those who benefit from the green
investment.

Public sector contributions in the form of offsets are justified to achieve a balanced
approach to cost sharing that reflects how all costs and benefits are incurred. Doing
this requires identification and quantification of benefits.."

So ultimately, the idea is that the public pays regardless of whether GI or LID is implemented on public land or on private land. What could these costs be in Ontario and what are the impacts to Ontario taxpayers?
Ontario has over 850,000 hectares of urban land use that
does not have enhanced stormwater management control, and
could be eligible for green infrastructure (LID) retrofits.

Ontario's SOLRIS land use mapping indicates 852,000 hectares of urban land use as of the year 2000. Previously we've estimated the capital cost considering a unit cost of $390,000 per hectare based on Ontario tender costs - see image ar right. All this urban land would in all likelihood have no water quality treatment and be eligible for stormwater managment enhancements. How do we know? Table 1 in the Economic Instruments to Facilitate Stormwater Management on Private Property report indicates that despite the use of quality controls, "Use of enhanced controls is negligible." (see table below).

If we retrofit the untreated area with GI / LID, the annualized cost would be simply $10,000 per hectare x 852,000 hectares = $8.5 billion per year ... forever.

Assuming this cost is allocated to municipalities who benefit from the green infrastructure, and these municipalities distribute the cost to Ontario households, we can estimate the annual household cost. The 2016 census indicates that there are 5,169,170 private households in Ontario meaning a cost of $1650 per household per year. Given household after-tax income of $65,285, the green infrastructure cost would represent about 2.5% of this income.

The Ontario stormwater infrastructure deficit has been estimated at $6.8 billion. If green infrastructure / low impact development lifecycle costs are not funded annually by taxpayers, and debt is used to fund the infrastructure investment, like a green bond, this deficit would double in a single year, and increase by the more than the existing deficit each and every year.

Allocating GI / LID costs seems like a shell game.
Allocating GI / LID costs seems like a shell game, shifting private property costs to the public sector, shifting public sector costs to
the downstream municipalities that accrue potential benefits. In the end there is only one source of funding however.... all of us. Elaborate credit systems, offset schemes, Drainage Act assessments, and fancy 'green bonds' are ways of spreading out the high up-front cost of LIDs. But ultimately, we all pay.

It will be interesting to see the next stages of the study authors' work and how the White Paper could be applied. The report states for example "The White Paper also provides background for a pilot study to be undertaken in the Southdown area of Mississauga. This study will examine the potential of aggregating private commercial property under the Drainage Act to secure installation of communal LID technologies and realize cost-efficiencies." The exploration of the Drainage Act was part of another study under the banner "Aggregated Communal Approaches to Green Infrastructure Implementation". The Drainage Act allows costs to be distributed to landowners across catchments in which improvements are made - the challenge is that landowners against whom costs are assessed have to buy in to the cost-sharing plan and can appeal.


Green Infrastructure Implementation Constraints in Flood Prone Partially-Separated Wastewater Systems

So what happens when green infrastructure infiltrates runoff into the ground in a densely-developed city? Does it disappear and sustain an aquifer and watercourse baseflows? That's the theoretical benefit. Or does it end up in foundations drains (weeping tiles) making its way to the local wastewater treatment plant on low rain days and contributing to sewer back-ups on the high rain days? its the latter. It is surprising how quickly foundation drains respond to surface water inputs - Toronto Water presented at the National Research Council expert panel this week that it takes only 4 minutes for surface water to end up in foundation drains!

Municipal wastewater engineers have know this for a while - that systems with no apparent direct inflows of rainwater or runoff respond quickly to rainfall. My work on a Municipal Class Environmental Assessment in Kitchener, Ontario showed the greatest correlation of wastewater peak wet weather extraneous flows was to the 5-minutes rainfall intensity. Often we expect groundwater collection systems in cities respond slowly to rainfall volumes - they don't. The respond rapidly to short duration rainfall.

So what does this have to do with green infrastructure and the suite of sweet low impact development measures many are going gaga over? Well, its the impact of GI and LID runoff infiltration on wastewater systems. Quick and clear impact. At the NRC expert panel this week I summarized a list of documents that expressed concern for GI and LID wastewater system impacts including aggravated basement flooding due to this infiltration. This is the list:

1) Water Environment Association of Ontario (July 17, 2017 memo) 

Identifies concerns of interference with wastewater systems (flood impacts), water distribution systems (chlorides/corrosion), human health impacts to drinking water distribution (compliance with Procedure F-6-1), excessive costs:

https://drive.google.com/open?id=1T3vXEJ_nBi8e30KpcawVTfFPKx7A6y_v

2) City of Ottawa (February 23, 2017 letter)

Indicates "While the intent appears to be not to "make things worse or better" (specifically with respect to current condition runoff volumes), there should be recognition of situations in older neighbourhoods (with partially separated sewers, for example) where increased infiltration should be avoided given the cumulative impacts over time that could raise groundwater levels leading to increased risk of basement flooding, increased I & I to sanitary sewers, etc.”:

https://drive.google.com/open?id=12IQjlaKvbCakqx7Brw9DJ97Oi5a0OHx-

3) City of Barrie (July 10, 2017 letter) 

Identifies financial impacts, capital cost increase of 200%, lifecycle cost increase of 550%, concerns for “damage to private properties and excessive sewer infiltration”, LIDs “highly susceptible to failure due to sand accumulation” :

 https://drive.google.com/open?id=1HDd24FpFmLsFTAA7kEdC5mk8N8Oau8Ox

4) City of Guelph (June 28, 2017 memo)

"Guelph downtown stone rubble masonry heritage buildings are prone to flooding with raised groundwater elevation; any additional infiltration measures using LIDs may aggravate basement flooding due to leaky masonry walls and severe impacts on the buildings structural stability; in addition, impacts on aged infrastructures such as, watermain corrosion, potable water quality interference (F-6-1) and enhanced sanitary infiltration can be anticipated.”

https://drive.google.com/open?id=1OAnqraDz9NuBD1ZCsY4dzeDXeyZzf66-

5) City of Markham (July 14, 2017 memo)

Identifies sanitary infiltration impacts, adjacent property impacts, excessive capital cost based on completed tenders, high soft cost, high lifecycle costs, chlorides/watermain corrosion:

https://drive.google.com/open?id=1RGwiyeaqihdmjI2owDY0R-Cw9CcGbEKu

6) Ministry of the Environment / Workshop on Stormwater Quality Best Management Practices (1992)

Identifies impacts of on-site infiltration source controls called Best Management Practices (BMPs):
 " - basement leakage problems related to infiltration near housing
   - surcharging of sanitary sewers by short circuiting of infiltrated water”
Therefore the impacts of green infrastructure have been long-known in Ontario. Unfortunately, green infrastructure is often cited as a panacea for water resources challenges in Ontario, often when only narrow view of is taken that ignores existing municipal infrastructure systems and practical constraints associated with the infiltration of large quantities of chloride and contaminant-laden stormwater runoff.

7) US Transportation Research Board / Evaluation of Best Management Practices for Highway Runoff Control, Issue 565 (2006)

Identified inflow and infiltration (I/I) risks with infiltration green infrastructure (BMPs) in urban areas:
“In urban areas, unrestricted infiltration may exacerbate infiltration and inflow (I/I) problems in both separate and combined systems”

https://books.google.ca/books?id=jKR-CF7PG6AC&printsec=frontcover&source=gbs_ge_summary_r&cad=0#v=onepage&q&f=false

7) City of Seattle / Street Edge Alternatives Project (city web site)

Identified bioretention groundwater impacts to adjacent properties through engineering analysis, indicating that green infrastructure introduces property flood risks:

"Our original hope for retaining flows and allowing infiltration into the native soils throughout the length of the block was not possible because some homes had an existing groundwater intrusion problem. To limit the potential for stormwater to adversely impact the residences of concern, our geotechnical engineers identified some swales that needed an impermeable liner.” :

http://www.seattle.gov/UTIL/EnvironmentConservation/Projects/GreenStormwaterInfrastructure/CompletedGSIProjects/StreetEdgeAlternatives/DrainageImprovements/index.htm

We could go on and on. The InfraGuide on inflow and infiltration, the CSA guideline on IDF curves - these all note the issue with infiltration stresses on wastewater systems.

Green energy in Ontario gave us smart metres that did not improve the flow of money. Green infrastructure can give us smart swales that will not improve the flow of groundwater .. OK, in partially-separated sewersheds.

Urban groundwater flow has been called the darkest of the dark arts, making hydrology look like algebra - call wastewater systems groundwater infiltration analysis something fancy like the RTK method and it sounds scientific, but there is really just a mysterious system of 'urban karst' of hidden pathways and problems lurking under the surface. A black box. Those of us in the industry who have worked closely on wastewater smoke and dye tests know that adjacent laterals 'speak to each other' and the subsurface flow is erratic and unpredictable.

As Jeff Goldblum said in Jurassic Park, 'Nature Finds a Way', and the natural flow of infiltrated water finds a way too ... right into foundation drainage and overtaxed wastewater systems. As Adrienne Barbeau said in The Fog "Be afraid, be very afraid" ... as there is huge fog surrounding green infrastructure and low impact development measures - we should re afraid of what these things will do to our wastewater systems.

Green Infrastructure Infiltration Increases Urban Flood Risks? GI Benefits in New Development Can Worsen Existing Infrastructure Stresses in Old Developments.

Cincinnati Bioswale
There is no doubt that Green Infrastructure (GI) or Low Impact Development (LID) measures are an essential tool in a water manager or municipal engineer's modern tool kit. In new developments, distributed green infrastructure, and even more centralized features, including rain gardens, bioswales, perforated pipes or pavers and infiltration galleries can help manage typical water balance impacts of urbanization by reducing downstream erosion stresses, sustaining natural heritage features like wetlands and streams that are often home to sensitive aquatic and terrestrial species. GI and LID measures do this largely by infiltrating urban runoff from hardened impermeable surfaces like rooftops and roadways or parking lots into the ground (see Ontario Ministry of Environment and Climate Change Interpretation Bulletin, February 2015). In some areas of the province that rely on groundwater for municipal water supply, these measures may also help sustain source water quantity and make aquifers more resilient to climate variability, especially long term droughts (e.g., see page 159, Policy ID REC-1 in APPROVED SOURCE PROTECTION PLAN: CTC Source Protection Region, 2015).

But....

In existing development areas, especially those built before the 1980's, infiltrating water into the ground as part of a GI or LID retrofit can have a significant downside for old muncipal infrastructure and private properties. That is because older infrastructure is sensitive to groundwater levels that drives infiltrated runoff into utility trenches, thorough cracks between joints of municipal sanitary sewers and service laterals, and into 1000's of kilometers of foundation drains surrounding properties with basements - drains that in many older areas connect to the sanitary sewer and ultimately drain to the municipal wastewater treatment plant.

This post explores how GI and LID infiltration stresses in old development areas can affect flooding risks, sewer overflow risks and watewater treatment costs in Ontario cities.

The risks from infiltration on wastewater systems is well-known. The Ontario Municipal Knowledge Network (OMKN) has highlighted the cost of treating infiltrated water and inflows in its 2008 General Inflow & Infiltration Management Practices - Best Practices Summary Report, also noting the first challenge related to Inflow and Infiltration (I&I or I/I) management is: "Protecting customers from basement flooding". Other concerns are "Increased flow to wastewater treatment plants and increased operating costs at the plants due to the excess volume of water requiring treatment". The OMNK's Best Practices Report Inflow and Infiltration - Increasing System Knowledge Through Flow Monitoring notes the drivers for managing I&I in Peel Region:

"There have been two catalysts for the Region’s I/I programs and studies: exceedance of system and plant capacities leading to sewer overflow and basement flooding occurrences"

More recently, infiltration has been noted as a concern by the insurance industry in terms of the lost wastewater system capacity and the impacts on basement flooding and insurance losses / damages. The Institute for Catastrophic Loss Reduction's investigations have recently indicated that " I/I directly contributes to flooding by filling up pipes with water, using up capacity that could convey larger storms".

And the potential impacts of GI and LID measures on wastewater system infiltration in Ontario was recognized ages ago -the former Ministry of the Environment conducted a Workshop on Stormwater Quality Best Management Practices in 1992 following the introduction of on-site infiltration source control LIDs called Best Management Practices (BMPs). The comprehensive Workshop Summary prepared by Marshall Macklin Monaghan Limited identifies concerns with on-site infiltration measures and these included:
“- basement leakage problems related to infiltration near housing
- surcharging of sanitary sewers by short circuiting of infiltrated water”

Lets look at quantifiable impact of groundwater infiltration on wastewater systems. For background, let's notes that groundwater infiltration is classified into two types in the sanitary sewer design profession:
  • Groundwater Infiltration (GWI)
  • Rainfall Dependent Inflow and Infiltration (RDII)
Green Infrastructure GI Low Impact Development LID Urban Basement Flooding Sewer Back-up Flood Risk Infiltration Stress
Groundwater Infiltration , Rainfall Dependent Inflow and Infiltration,
and other wastewater flow components to assess GI and LID Impacts.
From "An Approach for Estimating Groundwater Infiltration Rates
into Wastewater Collection Systems under Typical Year Conditions",
Zhang et. al. 2013
GWI is considered one component of Dry Weather Flow (DWF) which also includes Base Wastewater Flow (BWF). The hydrographs at right show these components of wet weather flow and are from An Approach for Estimating Groundwater Infiltration Rates into
under Typical Year Conditions by Li Zhang, Fang Cheng, Robert Herr, Gregory Barden, Hunter Kelly and Edward Burgess in " Journal of Water Management Modeling, R246-21. doi: 10.14796/JWMM.R246-21

Many GI and LID features are designed to get rain runoff or snow melt into the ground. The benefit in new development areas is that these practices sustain aquifer levels that in turn preserve baseflow rates to creeks (i.e., 'environmental flows') that sustain natural features. But the disbenefit in old areas is that raising groundwater levels raises GWI, using up sanitary sewer capacity that is no longer available during a big storm. As a result, when GWI goes up, so does basement flooding / sewer back-up risk because the previous wastewater system conveyance capacity is no longer available.

Green Infrastructure Basement Flooding
Groundwater Infiltration GWI Increases with Higher Precipitation.
From "An Approach for Estimating Groundwater Infiltration Rates
into Wastewater Collection Systems under Typical Year Conditions",
Zhang et. al. 2013
Can we quantify how infiltration affects GWI? Yes - using climate records and monitored wastewater flow rates, studies have correlated GWI rates to the amount of precipitation. At right, GWI in Cincinnati shows a strong correlation to precipitation on an annual basis. More precipitation means more infiltration, meaning higher GWI.

Low Impact Development Groundwater and Flooding Impacts
March Groundwater Infiltration GWI Increases Correlated
with Previous 15 Day Precipitation Total.
From "An Approach for Estimating Groundwater Infiltration Rates 
into Wastewater Collection Systems under Typical Year Conditions",
Zhang et. al. 2013
Seasonal influences of precipitation on GWI have also been found, with the highest spring GWI rates affected by precipitation over the previous 15 days. Zhang et. al's analysis in Cincinnati shows that if the previous 15 days were dry (no rain) the GWI flow at the plant was below 60 MGD, while with 2 inches of precipitation (about 50 mm), the GWI rate increased to about 90 MGD, a 50% increase.

Zhang et. al concluded "Significant positive
linear relationships were found between GWI and precipitation both annually
and monthly. The annual relationship showed that the adjusted R2 of the
regression result is 0.78, indicating that 78% of the varation of the yearly average
WWTP GWI can be explained by the annual precipitation."

LID and GI infiltration impacts wastewater systems and basement back-up risk
LID Runoff Reduction Benefits Can Lead to Groundwater Infiltration Stresses
In old developments with no GI or LID, limited precipitation infiltrates. It generally just runs off, collected in storm sewer systems. So only a small fraction of runoff is infiltrated. Monitoring by Credit Valley Conservation of the Elm Drive bioswale LID show the change in runoff when LIDs are retrofitted, indicating "69% of all rainfall is detained and infiltrated" in one study. The graph at right illustrates the runoff reduction benefit. Some detained runoff is evaporated or transpired by soil and vegetation in the LID feature, but some is infiltrated into the ground where it contributes to GWI and a portion of RDII. 

If half the runoff captured in the LID infiltrates, that would be equivalent to 35 % of rain infiltrating, as opposed to about 10% or less without the LID measure (i.e., 25% more infiltration). In the Toronto area, considering about 700 mm of rainfall a year, that would be like adding 25% x 700 mm = 175 mm of water into the ground each year (about 7 inches). In Cincinnati, 7 inches of annual precipitation increased GWI by 20% - that is before any runoff transformation or evaporation losses. So adding 7 inches of water directly into the ground with an LID would have an even more pronounced impact on GWI, with potentially more than a 20% increase. Added to this long term, slow GWI response impact, would also be short duration RDII increases that even further reduce wastewater system capacity as the extreme events infiltrate into LID measures as well. Practitioners know that even fully separated wastewater systems where inflow sources have been addressed can have large RDII components, suggesting that infiltration can have a fast response as well, taking away peak flow capacity. 

The take-away is that what is a benefit to new developments is not typically one in old developments, across cities with existing GWI and RDII stresses and resulting basement flooding risks and treatment costs that can be made worse by infiltrating rain the previously was runoff.

Any positive impacts to wastewater systems with GI and LID measures? Yes, potentially a few in some isolated areas.

Consider existing infrastructure
impacts when evaluating green
infrastructure and low impact
development measures effects on
groundwater, wastewater
system capacity and operating costs.
There area where GI and LID may contribute to positive wastewater system performance is in combined sewer areas. In those areas, holding back runoff in GI and LID measures that would enter combined sewers could reduce combined sewer overflows (CSO's) - but not all Ontario cities have combined sewers. In Toronto, only 23% of the systems are combined. Also, GI can be expensive compared to other technologies (about $400,000 per hectare in capital costs, or about $1.3M-1.5M per kilometre of retrofitted roadway). An often cities have F-5-5 control strategies and operation improvements that make GI and LID implementation redundant. For example in Toronto, wastewater and stormwater runoff from combined sewer areas will collected and fully treated as part of projects needed for operational improvements (e.g., to regularly maintain and bypass the main Coxwell Ave. sewer) - so adding LID and GI measures on top of other infrastructure projects that will already virtually eliminate CSO's would appear to be redundant, with high incremental added costs and limited marginal benefits.