What COVID-19 Taught Us About Observed Data vs. Model Projections: They Are Different - Let's Remember That When Interpreting Climate Models

COVID-19 data vs models climate change projections model uncertainty
COVID-19 - observed data on ICU cases and projected capacity
"All models are wrong, some are useful".  Predicting COVID-19 conditions has taught us that models come with a great deal of uncertainty, and are based on a lot of assumptions.  Furthermore, models have to be constantly updated over time with real observed baseline data to represent the starting point for future predictions. At least we recognize the difference between theoretical model projections and the past observations on COVID-19 conditions.  More attention should be given to the difference between theoretical models of climate effects and observed changes in extreme weather.

In early April, COVID-19 ICU cases were projected to increase to 1200 in a best case to about 1500 in a worst case in Ontario, increasing considerably from actual data counts in late March.  The chart at right shows that ICU beds peaked at under 300 cases by mid April, a fraction of the best case model prediction, and has declined since.  So model projections should be viewed with some caution, and the reliability of the projections should be questioned and validated where possible with real data.

Predicting future weather extremes due to climate change effects has a great deal of uncertainty as well.  The recurrence time of extreme rainfall is predicted to decrease due to climate change effects, meaning that the "return period" of storms would become smaller.  For example, a rainfall event that had a return period of 35 years today (meaning a probability of occurring in any year of 1/35, or 1 in 35) has been predicted to occur every 12 years in the future (i.e., a higher probability of happening each year of 1/12 or 1 in 12 ... that a greater chance than today's 1/35).  That is what is projected to occur in Canada from now to 2100.

The above example on decreasing recurrence times is from a simulation presented in Canada's Changing Climate Report by Environment Canada (link: https://changingclimate.ca/CCCR2019/).  It is for a future scenario with several assumptions about growth and emissions called the RCP8.5 scenario, representing a Representative Concentration Pathway of just one of several future scenarios.  The shift in 24-hour precipitation recurrence times are presented on Figure 4.20 b shown below:

Canada's Changing Climate Report Extreme Precipitation Return Period Recurrence Times RCP8.5 Model Simulations
Canada's Changing Climate Report Figures 4.20 b), Projected Extreme Precipitation Recurrence Time / Return Periods for Past, Present and Future Time Periods, RCP8.5 Model Simulation Scenario

As annotated above, today's recurrence time is noted as 35 years, the future recurrence time is 12 years and the past time was 50 years. So the model predicts these shifts in recurrence time (return period) and annual probability:

   Period         Recurrence Time       Probability Each Year
1986-2005             50 years                       2.0 %   (1/50)
2016-2035             35 years                       2.9 %   (1/35)
2081-2100             12 years                       8.3 %   (1/12)

Some have misinterpreted the theoretical, simulation model changes from past to present as 'actual' observed changes in extreme precipitation when in fact the Environment Canada report clearly notes these are 'projected changes' and are 'simulated by Earth system models' for the scenario RCP8.5.  A different scenario's simulated results, with different assumed emissions and growth, and different recurrence time shifts are presented in Figure 4.20 a) as well.

CBC News In Our Backyard Extreme Rainfall Trends
CBC News In Our Backyard - Flooding
CBC's In Our Backyard interactive notes "Climate change is no longer theoretical. It’s in our backyard" - unfortunately it presents theoretical past model trends as real changes that are "In Our Backyard" now.  Here is the online report link: https://www.cbc.ca/news2/interactives/inourbackyard/

CBC News report: "Climate change is making extreme rainfall a more frequent occurrence. Storms that historically happened only once every 50 years are now coming every 35 years or less. By the end of the century, they could happen once every 12 years on average, according to a recent climate report from Environment Canada. All this increases the potential for urban flooding."

CBC News Past Present and Future Rainfall Recurrence Time Return Periods for for Severe Storms
CBC News In Out Backyard Extreme Rainfall Frequency - Past, Present, and Future Recurrence Times Confuses Simulation Model Projections With Observed, Historical Trends


So while predicted changes are only theoretical, CBC News mistakenly reports that changes have already occurred and are 'now coming' at smaller recurrence intervals (i.e., higher frequency and higher probability each year).

The CBC Ombudsman has indicated that the CBC should be careful to distinguish between past, present and future extreme rainfall trends, as noted in a recent post: https://www.cityfloodmap.com/2020/05/past-present-or-future-cbc-ombudsman.html

We agree.

A review of historical extreme rainfall trends in one region of Canada affected by may flooding events has shown no decrease in the recurrence time, or return period, of extreme precipitation.  A previous post showed that today's 35 year storms are actually occurring less frequently than in the past. In southern Ontario, long term climate station observations show that the average 25 to 50 year rainfall intensities today are actually slightly smaller than they were considering observations up to 1990. See previous post: https://www.cityfloodmap.com/2020/05/southern-ontario-extreme-rainfall.html

Analysis of the Version 3.10 Engineering Climate Datasets IDF Files updated in March 2020 show that southern Ontario long term rainfall intensities have decreased slightly since 1990, on average by 0.1%.  The 50 year return period rainfall intensities are on average unchanged.

If 50 year rainfall intensities actually occurred more frequently and now occur at a 35 year return period, as CBC mistakenly reported, then the magnitude of the 50 year intensities would have had to increase by about 6%.  This considers the example long term climate station at Toronto's Pearson International Airport - the 35 year 24-hour rainfall intensity of 99.7 mm at the airport would have to increase to the 50 year intensity of 105.7 mm.  Back in 1990, the 50 year 24-hour rainfall intensity at the airport was 109.3 mm, meaning the 50 year rainfall has decreased by several percentage points.  Here are the 1990 data (copied from my top desk drawer):

Toronto Extreme Precipitation Trends Climate Change Effects on Rainfall Intensity
Toronto Pearson International Airport IDF Table With Data Up to 1990 - 50 year design rainfall intensity of 109.3 mm  (shown here) was higher than today's version 3.10 Engineering Climate Datasets intensity of 105.7 mm (see table below to 2017).  

Here are the recently updated IDF values from Environment Canada considering data up to 2017:
Toronto Extreme Precipitation Trends Climate Change Effects on Rainfall Intensity
Toronto Pearson International Airport IDF Table With Data Up to 2017 - 50 year design rainfall intensity of 109.3 mm (see previous table to 1990) shown is lower than today's version 3.10 Engineering Climate Datasets intensity of 105.7 mm (shown here).

Climate models that predict more frequent future rainfall intensities, characterized by shorter recurrence times (i.e., lower return periods = higher probabilities of occurrence) are not necessarily in step with observations (see Toronto airport example above and previous post on southern Ontario long term stations).  Here is a comparison of past trends in 100-year rainfall intensity based on observed data and projections from various studies - the actual data curve is already 'flat', so the need to flatten the curve can only be made based on projections and not past data.
COVID-19 and Climate Change Effects on Extreme Weather Data vs Models and Uncertainty
Extreme Rainfall IDF Trends - Toronto 24-Hour 100-Year Rainfall Volumes per Environment Canada Engineering Climate Datasets - Past Data and Linearly Projected Trends Shown in Black.  Various Studies and Models Project Significant Increases That Have Not Shown Up In The Data Observed Data Statistics
Just like COVID-19 models have considerable uncertainty and must rely on observational data to calibrate and validate them - so they they are more reliable and useful in making projections of the future - climate models require checks on accuracy and usefulness.  Media like CBC News may not discern between model predictions and actual trend data which can mischaracterize trends in extreme weather.  Since models predicting extreme rainfall do not appear to match past observations over the recent past few decades, the accuracy and reliability to project conditions over the next 80 years should be closely scutinized.

While in the case of COVID-19, the need for "flattening the curve" is clear given the close scrutiny of observed data that has shown rising counts of infections, hospitalizations or deaths - that gives clear direction on actions to be taken to mitigate observed phenomena.  In the case of COVID-19, these values may even increase at an exponential rate.  In contrast, the IDF curve trends are largely flat if not already declining based on observed data in some regions.  Any change in extreme rainfall trends has been explained by natural variations (i.e., trends can go up).

***

There is a long-standing gap in the media mixing up predictions of extreme weather and actual Environment Canada observed data trends - sometimes a single report can start a narrative that can go unchecked for some time.  The "Telling the Weather Story" report is one such example where a theoretical shift in extreme weather has been reported, and repeated endlessly in the media as actual data when it is clearly not:


Southern Ontario Extreme Rainfall Trends - Environment Canada Engineering Climate Datasets IDF Tables

Environment Canada's version 3.10 update to Canada's rainfall IDF tables and curves shows more increases than decreases and slightly more significant increases than decreases - overall trends were shown in a recent post: https://www.cityfloodmap.com/2020/05/annual-maximum-rainfall-trends-in.html.

Regional trends may be up or down and warrant further review.  In Southern Ontario the IDF intensities for long term stations have been reviewed and compared with pre-version 1.00 statistics up to 1990 (similar to version 3.00 and version 2.30 comparisons shared in earlier posts).  The following table shows average changes since 1990, and the surrounding arrows suggest how these changes may influence infrastructure design, if at all.

Southern Ontario IDF Rainfall Intensity Trend Table - Environment and Climate Change Canada's Engineering Climate Datasets, Pre-Version 1.00 (up to 1990) to Version 3.10 (up to  2017)

The 21 stations assessed include:  Sarnia Airport, Chatham WPCP, Delhi CS, Port Colborne, Ridgetown RCS, St Catharines Airport, St Thomas WPCP, Windsor Airport, Brantford MOE, Fergus Shand Dam, Guelph Turfgras CS, London CS, Mount Forest (Aut), Stratford WWTP, Waterloo Wellington Airport, Bowmanville Mostert, Hamilton Airport, Hamilton RBG CS, Oshawa WPCP, Toronto City, Toronto International Airport (Pearson).

The above changes in design rainfall intensities since 1990 do not suggest any overall shift that would affect how municipal drainage infrastructure would be designed considering current weather conditions.  That is, overall intensities have decreased by 0.2% which in negligible.  The 5-minute, 2-hour and 6-hour intensities decreased consistently across all return periods.  The change however is also negligible.  On average frequent intensities, e.g., 2-year intensities expected every couple of years, and 5-year intensities, used for storm sewer design showed overall decreases.  Again the changes are negligible.  The 100-year intensities increased by 0.1% overall which is also negligible, especially considering the confidence limits with such statistics and the uncertainty in curve fitting (Gumbel distributions are used, other distributions would provide shifts in results).  One would expect rare intensities to increase over time for skewed distributions given sampling bias with short records (i.e., limited observations of extreme events are expected to lead to underestimates of 100-year statistics).

Of course considerations must be made to account for future changes and uncertainties.  Some cities and regions have incorporated allowance for climate change effects.  In Quebec a 18% allowance is standardized.  Some cities (e.g., Ottawa) include a 20% stress test to evaluate any unacceptable conditions that warrant design changes to address future potential risks.  Others incorporate stress test hyetographs in the design process - the Windsor/Essex Ontario standards include a stress test event that has 39% greater volume than the standard 100-year design storm (NB - the daily volume is increased to account for that additional volume distributed uniformly across 24 hours, while peak hyetograph intensities are only nominally affected). 

The chart below shows the IDF trends at these long-term record Southern Ontario stations.

Southern Ontario IDF Rainfall Intensity Trend Chart by Duration - Environment and Climate Change Canada's Engineering Climate Datasets, Pre-Version 1.00 (up to 1990) to Version 3.10 (up to  2017)

It is clear that that the short duration intensities (red and orange bars representing 5 and 10 minute durations) have decreased the most as shown in the table above. The chart and table below shows a more simplified version of the above chart indicating the range of changes observed.

Southern Ontario IDF Rainfall Intensity Trend Chart by Duration - Environment and Climate Change Canada's Engineering Climate Datasets, Pre-Version 1.00 (up to 1990) to Version 3.10 (up to  2017)

The above chart shows that 2-year and 5-year IDF rainfall intensities have decreased most consistently among all stations.  Those intensity estimates benefit from many observations each year to determine the statistics.  Rare event intensities from 25-year to 100-year return periods have more equal increases and decreases yet the decreases are greater.  The magnitude of the changes, both increases and decreases are on average negligible.  Even the greatest increase of 1.2% from 1990 to 2017 (27 years) is negligible for the purpose of hydrologic analysis and drainage infrastructure design.


Toronto Area Extreme Rainfall Intensity Trends - Environment Canada IDF Curve Updates 2020

Environment and Climate Change Canada's intensity duration frequency (IDF) data describes the rare extreme rainfall intensities used to design drainage infrastructure and to assess river peak flows/flood flows when the big storms hit.

Some climate station IDF analysis have been due for an update for several years.  The new version 3.10 update in 2020 extends analysis to 2016-2017 in many cases.  The trends in short duration intensities can show how flood risks are changing due to changing climate and any more severe weather. Many municipalities and researchers have updated their IDF statistics internally and have reported trends in extreme rainfall intensities (see previous post for Ontario studies: https://www.cityfloodmap.com/2020/05/annual-maximum-rainfall-trends-in.html).

Earlier versions of the IDF datasets are available to characterize annual maximum rainfall, dating back to 1990.  The tables below shows updated trends in 100-year rainfall intensity over a short 5 minute duration at Buttonville Airport in Markham (updated in version 3.10 in 2020) and in Toronto and Mississauga (updated in version 3.10 in 2019).


For short durations, it appears that extreme rainfall intensities are decreasing in the Greater Toronto Area.  The rare 100-year intensities are decreasing from 4-7% at the three locations above.  The more frequent 2-year intensities are decreasing by about 5-8%.

There is higher uncertainty with 100-year storm intensities due the rarity and spatial distribution of events.  However, the more frequent 2-year intensities that rely on many more rainfall observations every year to characterize these average annual peaks are more reliable.  To illustrate this, consider the 95% confidence bands on the Environment Canada IDF 5-minute data for Buttonville Airport, in southern York Region, just north of Toronto:
Extreme Rain 95% Confidence Bands Buttonville Airport, Markham, Ontario - Environment Canada Engineering Climate Datasets v3.10
The 100-year 95% confidence band of 97 mm/hr (2 x 48.5) is 46% of the expected value of 210.8 mm/hr.  In contrast, the 2-year band of 22.6 mm/hr is only 22% of the expected value of 104.7 mm/hr, a relatively tighter band.  The tight band makes the observed decrease in 2-year rain intensities more noteworthy, i.e., the 2-year intensity has decreased 7.6% which is a significant proportion of the uncertainty band.

The longer duration annual maximum rainfall series for Toronto and Mississauga have relatively tighter confidence bands for both 100-year and 2-year intensities:

Extreme Rain 95% Confidence Bands Pearson International Airport, Mississauga, Ontario - Environment Canada Engineering Climate Datasets v3.10

Extreme Rain 95% Confidence Bands Toronto, Ontario - Environment Canada Engineering Climate Datasets v3.10

Given that rainfall intensities are decreasing over most durations in the Greater Toronto Area, based on Environment Canada's annual maximum series and derived 2-year and 100-year IDF design intensities, why does media often report a 'new normal' of more extreme weather?  This may be due to lack of familiarity with data and a tendency to exercise an 'availability bias', i.e., simple listing of recent events that have caused damages and association of those events with increasing rainfall intensities, but without checking the actual rainfall trends or investigating other factors.  For more on cognitive biases in framing and solving complex problems read about Thinking Fast and Slow on Floods and Flow:   https://www.chijournal.org/C449.   Given the proliferation of rainfall gauges across the GTA, many more than the Environment Canada numbers, the observation of many extreme events over a short duration may not be a statistical anomaly at all, as analysis here shows: https://www.cityfloodmap.com/2019/03/are-six-100-year-storms-across-gta-rare.html

The CBC has made several corrections to its stories on changing extreme rainfall trends in the past, sometimes finding violation of its Journalistic Standards and Practices regarding accuracy of reporting - here are some examples: https://www.cityfloodmap.com/2019/06/cbc-correcting-claims-on-extreme.html.  Most recently the CBC Ombudsman in a review entitled "Past, Present, or Future" wrote that "journalists could have been clearer with their choice of tenses" - more on that here: 

The CBC Ombudsman stated "There are appropriate distinctions made between observed phenomena and predicted phenomena" in its reporting noting this excerpt: 
  • Precipitation will increase in much of the country.
  • Weather extremes will intensify.
The last two bullet points are careful to use the future tense.

The recently updated Environment Canada IDF data in the GTA supports the CBC's perspective that intensified weather extremes are predicted phenomena as opposed to observed ones.


Annual Maximum Rainfall Trends in Canada - Environment Canada Engineering Climate Datasets v3.10 Update

A recent post (https://www.cityfloodmap.com/2020/02/annual-maximum-rainfall-trends-in.html) reviewed trends in annual maximum rainfall, their direction and statistical significance (i.e., showing whether the trends strong or are mild and just reflect normal variations).

Now there is an update. Environment and Climate Change Canada has just released v3.10 of the Engineering Climate Datasets that include annual maximum series data used to derive IDF curves, as well as the trends in those annual maximum series.  (note: trend data are contained in the comma delimited text file idf_v-3.10_2020_03_27_trends.txt in the IDF_Additional_Additionnel_v3.10.zip file on the Environment Canada download site).

Overall many additional stations have been added to the trend analysis.  Version 2.30 had 565 stations, Version 3.00 had 596 station and Version 3.10 now has 651 station.  The average length of record is 25.5 years.  How have the trends in annual maximum rainfall changed? The 3 charts below show that the change is very gradual, there are more significant increases than decreases, but overall the percentage of non-significant trends is unchanged.

Annual Maximum Rainfall Trends in Canada Environment Canada Engineering Climate Datsets
Maximum Rainfall Trends in Canada - Engineering Climate Datasets v3.10, v3.00 and v2.30, Environment and Climate Change Canada
The summaries at the bottom show:

Trend in Maximum Rain   v3.10        v3.00         v2.30
Significant Increase            4.28%      4.18%        4.09%
Significant Decrease           2.24%      2.33%        2.30%
No Significant Trend        85.80%     85.55%      86.37%
No Calculation                    7.68%      7.94%        7.24%

How about regional trends? Some provinces have more decreases than increases:

annual maximum rainfall environment canada data trends
Annual Maximum Rainfall Trends in Canada, by Province / Region - Environment and Climate Change Canada Engineering Climate Datasets v3.10 (March 2020)


Trends in the Toronto area are shown on the following charts for the City of Toronto, City of Mississauga (Pearson Airport), and City of Markham (Buttonville Airport).

City of Toronto Annual Maximum Rainfall Environment Canada
Toronto Maximum Rainfall
City of Mississauga Annual Maximum Rainfall Environment Canada
Mississauga Maximum Rainfall

Markham York Region Maximum Rainfall Annual Maximum Rainfall
Markham, York Region Maximum Rainfall

Trends in Toronto indicate annual maximum rainfall is decreasing for all durations from 5 minutes to 24 hours.  The decrease for the 12 hour duration is statistically significant.

Trends in Mississauga at Pearson Airport are decreasing for most durations, however the 1 hour duration trend is increasing due to the July 8, 2013 peak.  No Mississauga trends are significant.

Trends in Markham, in southern York Region are decreasing for shorter durations of 30 minutes or less and increasing for longer durations. None of the trends are significant.


Past, Present, or Future? CBC Ombudsman finds "It would have been wrong to state categorically that Canada has already seen an increase in extreme rainfall events" - So What is Causing Flooding?

Fort McMurray Ice Jam Historical Flood Events
Fort McMurray Historical Ice Jam Events
Flooding caused by extreme weather has unfortunately been a significant threat to Canadians for decades.

Recent flooding in Fort McMurray, Alberta highlights how devastating flooding can be, causing widespread damage and even loss of life.  Often flood risks are long-standing and challenging to address.  For example, Fort McMurray flooding has been affected by ice jams since 1875, based on Review of flood stage frequency estimates for the City of Fort McMurray: Final report by
Alberta Environmental Protection, Technical Services and Monitoring Division (https://era.library.ualberta.ca/items/f6f26d4e-005d-462b-8d7c-0428db8f7d27).

In order to effectively manage flood risks, it is important to understand the causes.  Understanding if flood risks are increasing and if current management practices are working to prevent or mitigate risks is important.

Often journalists focus on changes in weather and climate as the primary cause of flooding, or increased flood damages.  In fact, historical land use practices and development that began in high risk areas a century before modern flood hazard mapping explains baseline flooding in many parts of Canada.  Redevelopment and intensification in these hazard areas can lead to increasing damages over time. Stay tuned for a future post with some examples.

Recently the CBC Ombudsman reviewed how CBC journalists report on past, present and future changes in extreme weather related to flooding in its In Our Backyard series, initiated last summer.  The full review is here: https://cbc.radio-canada.ca/en/ombudsman/reviews/Past-Present-or-Future.

What did the Ombudsman find?  Well, that "It would have been wrong to state categorically that Canada has already seen an increase in extreme rainfall events", recognizing that has already been reviewed in detail by CBC Radio-Canada Ombudsman Guy Gendron: https://site-cbc.radio-canada.ca/documents/ombuds/reviews/Review%20Robert%20Muir.pdf

The Ombudsman also found that "journalists could have been clearer with their choice of tenses". He
pointed to CBC reporting showing that changes in extreme precipitation are predicted in the future, but have not occurred already from past to present:

"The key stories make no direct claims, for instance, that more severe storms have been observed in Canada. What I saw was often a real effort made to lay out the issues with broad strokes, and avoid getting bogged down in details. Take this excerpt, for example, from the Harrison column:

According to the federal government's recent assessment, Canada's Changing Climate Report, there is "high confidence" that:

  • Canada is warming at twice the global rate, and our north is warming at three times that rate.
  • We can expect more extreme heat, warmer winters, earlier springs and rising sea levels.
  • Precipitation will increase in much of the country.
  • Weather extremes will intensify.

The last two bullet points are careful to use the future tense. If, as it appears, Mr. Harrison was the architect of this series, there’s no sense of an attempt to mislead, change facts or distort reality. There are appropriate distinctions made between observed phenomena and predicted phenomena."

So this is positive that CBC recognized the difference between observed phenomena and predicted ones.

While the Ombudsman got it right - more severe storms have not been observed - recent "In Our Backyard" reporting at CBC has already mixed up observations and predictions on this topic.  The Flooding tab in this report https://www.cbc.ca/news2/interactives/inourbackyard/ presents the following:


CBC states that extreme rainfall that had a 50 year recurrence time is now happening every 35 years., implying an observed phenomena. What report is CBC referring to? It is Canada's Changing Climate Report: https://changingclimate.ca/CCCR2019/chapter/4-0/

Specifically, Section 4.3.2.2 Projected changes and uncertainties includes a chart Figure 4.20 b) with simulation model projections.  Here it is:


The red line representing extreme 50-year storm events has model simulations from past to present to future, showing a predicted decreasing recurrence time (often called a "return period", the inverse of the storm's annual  probability of being exceeded).

Obviously the CBC can do better in terms of getting some basic details right - it may even be worthwhile getting "bogged down" in important details like the difference between observed and predicted changes in the factors affecting flooding.  As the Ombudsman wrote, there is a need to avoid 'shortcuts' that create 'ambiguity':

"I am not prepared to conclude that this was a violation of policy, but rather as a reminder that there cannot be shortcuts in language if they create ambiguity. This is a particular challenge in broadcast, where being concise is so critical, but editors and reporters should not leave out any word if it is necessary to sharpen the clarity of the reporting. When CBC is referring to the future, it would be better to say so. That way viewers won’t be left guessing."

Mixing up past, present and future continues to create ambiguity, leaving CBC viewers misinformed about actual extreme storm trends.  Unfortunately, this can divert attention from the other factors that affect flooding and that should be given our attention when managing long-standing risks.

Green Infrastructure, Low Impact Development (LID) Construction Costs

A costing tool was developed to assess the capital and operation and maintenance costs of infrastructure used to control CSO's by Capital Region Water, a municipal authority that improves, maintains, and operates the greater Harrisburg, Pennsylvania USA area’s water system and infrastructure.

Unit cost data for various green infrastructure, or Low Impact Development (LID) stormwater management practices, are provided in Capital Region Water's costing tool and it's reference Appendix B - Basis of Cost Opinions, Combined Sewer Overflow Control Alternatives, Costing Tool Reference Manual, Updated 2017 (https://pdf4pro.com/cdn/appendix-b-basis-of-cost-opinions-capital-6c71f.pdf).

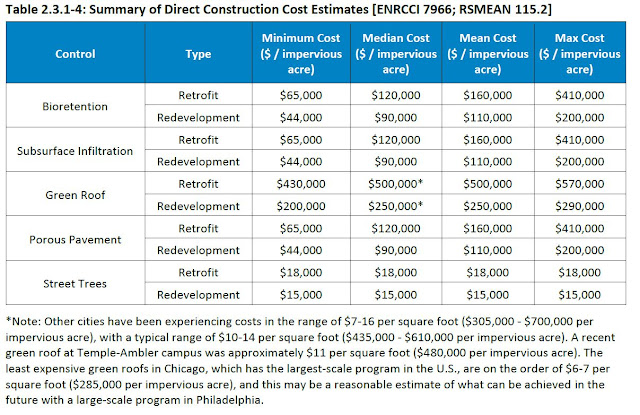
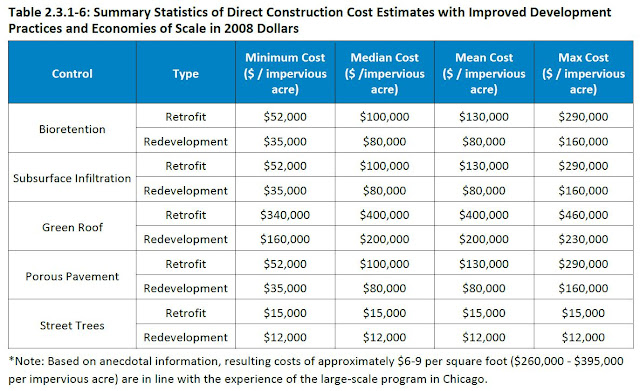
The following tables illustrate 2008 unit costs per impervious acre. The first considers costs with limited cost efficiencies or savings over current costs.  The second table considers that cost reductions can be achieved under widespread implementation with economies of scale.

green infrastructure bioretention infiltration porous pavement green roof street trees capital construction cost
Green Infrastructure Costs in Retrofit and Redevelopment Settings - Bioretention, Subsurface Infiltration, Green Roof, Porous Pavement, and Street Trees - 2008 Dollars, Harrisburg, PA, USA
low impact development LID bioretention infiltration porous pavement green roof street trees capital construction cost
Reduced Green Infrastructure Costs in Retrofit and Redevelopment Settings  With Assumed Economies of Scale - Bioretention, Subsurface Infiltration, Green Roof, Porous Pavement, and Street Trees - 2008 Dollars, Harrisburg, PA, USA

The unit costs above, excluding green roofs and streets trees, result in a mean cost of $160,000 per impervious acre for retrofits and $110,000 for redevelopment.  This equates to mean costs of $395,000 and $272,000 per impervious hectare.

Adjusting costs to 2020, based on the Statistics Canada Infrastructure Construction Price Index, increases 2008 costs by 30%. The following table presents 2020 estimated unit costs per impervious hectare.

Summary Statistics of Direct Construction Cost Estimates in 2020* Dollars ($/impervious hectare)
Control Type Minimum Cost
($ / impervious hectare)
Median Cost
($ / impervious hectare)
Mean Cost
($ / impervious hectare)
Max Cost
($ / impervious hectare)
Bioretention Retrofit $209,000 $386,000 $514,000 $1,317,000
Redevelopment $142,000 $289,000 $354,000 $642,000
Subsurface Infiltration Retrofit $209,000 $386,000 $514,000 $1,317,000
Redevelopment $142,000 $289,000 $354,000 $642,000
Green Roof Retrofit $1,382,000 $1,607,000 $1,607,000 $1,830,000
Redevelopment $642,000 $803,000 $803,000 $932,000
Porous Pavement Retrofit $209,000 $386,000 $514,000 $1,317,000
Redevelopment $142,000 $289,000 $354,000 $642,000
Street Trees Retrofit $57,000 $57,000 $57,000 $57,000
Redevelopment $48,000 $48,000 $48,000 $48,000
Average Excl. Green Roof and Street Trees Retrofit $209,000 $386,000 $514,000 $1,317,000
Redevelopment $142,000 $289,000 $354,000 $642,000

* 2008 to 2020 adjustment estimated at +30% considering Infrastructure construction price index (+26.9% for 2010-2019)


The average retrofit cost for bioretention, subsurface infiltration and porous pavement is $514,000 per impervious hectare for retrofits and $354,000 per impervious hectare for redevelopment.  Lower costs with expected cost efficiencies are estimated below, adjusting 2008 cost to 2020 (i.e., increase by 30%).

Summary Statistics of Direct Construction Cost Estimates with Improved Development Practices and Economies of Scale in 2020 Dollars ($/impervious hectare)
Control Type Minimum Cost
($ / impervious hectare)
Median Cost
($ / impervious hectare)
Mean Cost
($ / impervious hectare)
Max Cost
($ / impervious hectare)
Bioretention Retrofit $166,000 $321,000 $417,000 $932,000
Redevelopment $112,000 $257,000 $257,000 $514,000
Subsurface Infiltration Retrofit $166,000 $321,000 $417,000 $932,000
Redevelopment $112,000 $257,000 $257,000 $514,000
Green Roof Retrofit $1,092,000 $1,284,000 $1,284,000 $1,478,000
Redevelopment $514,000 $642,000 $642,000 $738,000
Porous Pavement Retrofit $166,000 $321,000 $417,000 $932,000
Redevelopment $112,000 $257,000 $257,000 $514,000
Street Trees Retrofit $48,000 $48,000 $48,000 $48,000
Redevelopment $39,000 $39,000 $39,000 $39,000
Average Excl. Green Roof and Street Trees Retrofit $166,000 $321,000 $417,000 $932,000
Redevelopment $112,000 $257,000 $257,000 $514,000
The retrofit and redevelopment costs of $417,000 to $257,000 per impervious hectare would be equivalent to costs of $834,000 to $514,000 per hectare, assuming 50% impervious coverage.  These costs are of similar magnitude to average Ontario and Alberta LID project costs presented in an earlier post (see update at the bottom of the post https://www.cityfloodmap.com/2019/10/green-infrastructure-cost-ontario.html). Compiled LID project costs indicate an average area-weighted cost of $540,000 per hectare, including several recent project costs that have not yet been adjusted, i.e., increased, to today's 2020 dollars.

While project costs are expected to vary from site to site, average unit costs may be used for planning purposes, when evaluating the cost to retrofit large areas, e.g., sewer catchments or tributary subwatersheds where stormwater management controls are being evaluated.

***

Notes: while economies of scale have been assumed with widespread implementation, trends in unit costs in Philadelphia had not yet revealed decreasing unit costs as indicated in an earlier post (https://www.cityfloodmap.com/2018/07/green-infrastructure-capital-and.html) and as shown in the chart below:

Green Infrastructure Low Impact Development LID GSI Capital Cost Trend
Green Infrastructure / Low Impact Development Capital Cost Trend - Philadelphia Clean Waters Pilot Program


Toronto and Mississauga Lost Rivers and Urban Flooding

Just a few GIS maps illustrating urban flooding risks in Toronto and Missisauga, showing lost rivers and historical flooding locations (Toronto May 2000 [orange symbol] and Toronto August 2005 [red symbol] storms and Mississauga July 2013 [yellow symbols]).  The lost river major overland flow paths for small catchments (less than 1000 hectare drainage area) are estimated using the rationale method with the SOLRIS Version 2 land use-derived runoff coefficients, times of concentration derived from the MNRF WRIP enhanced DEM to estimate peak rainfall intensity, and approximate uniform flow depth and spread approximations along the centreline flow path. The land use shown is the province of Ontario's SOLRIS Version 3 data, which helps show where overland flow paths are in channels, open spaces, parks and easements vs. through developed areas where original drainage features have been enclosed over time.

Toronto - East End: good slopes toward Lake Ontario, the Don River valley and Taylor Creek. Little flooding in May 2000 and August 2005 (those storms did not affect this area greatly however).

Lost Rivers Toronto Flood Pluvial Flooding Beaches East York Riverdale Leslieville

Toronto - West End: a few flood clusters along the lost river flow paths.

Lost Rivers Toronto Flood Pluvial Flooding Etobicoke

Toronto - North End (Newtonbrook area): significant flooding in low relief areas, clusters of flooding along other lost river flow paths. Highest concentration of flooding area in 'partially separated' sewer servicing areas where foundation drains contribute wet weather flow to the wastewater collection system and overland flow paths were not explicitly designed.

Lost Rivers Toronto Flood Pluvial Flooding North York Newtonbrook

Mississauga - Malton Area: Older development, less resilient servicing standards.  Flooding locations are approximate but appear to show concentration along the downstream end of the large central 'lost river', north of the 401.

Lost Rivers Mississauga Flood Pluvial Flooding Malton

Mississauga - Cooksville Creek: A large 2000 mm diam. trunk sewer runs along the 'lost river' flow path in the centre of the map, south the the QEW.  This branches to two large trunk under the QEW and upstream.  Flooding locations are approximate.

Lost Rivers Mississauga Flood Pluvial Flooding Cooksville Creek