The following paper was presented at the WEAO 2020 Collection Systems Committee Fall Webinar on October 28, 2020. The presentation made is included after the paper. Paper download: download pdf
The complete guidelines can be downloaded here: https://nrc-publications.canada.ca/eng/view/object/?id=27058e87-e928-4151-8946-b9e08b44d8f7
***
National Guideline Development for
Benefit-Cost Analysis of Storm Drainage Infrastructure
Robert J. Muir, M.A.Sc., P.Eng., Dillon
Consulting Limited, Fabian Papa*, M.A.Sc., M.B.A., P.Eng., FP&P HydraTek Inc.
*FP&P HydraTek Inc., 216 Chrislea
Road, Suite 204
Vaughan, Ontario L4L 8S5
INTRODUCTION
Flooding
is a matter of significant importance to Canadians and is a high priority for
all levels of government involved in its management and mitigation. Economic impacts to communities and
businesses can be significant in terms of the direct and indirect costs, and
affected industries have a heightened interest in mitigating insured
losses. Governments and flood management
agencies responsible for upgrading infrastructure to reduce these impacts
recognize that decision-making on funding levels and project prioritization
must be supported by sound economic analysis to assess upgrade costs and the
benefits of avoided losses. While rigorous benefit-cost analysis frameworks
have been developed and applied in other jurisdictions worldwide, application
in Canada has been limited with the exception of regionally-significant river
projects.
To
support decision making on urban infrastructure investment, the National
Research Council of Canada (NRC) is developing guidelines on the assessment of benefits,
costs and uncertainties relating to storm drainage infrastructure in a changing
climate. The guideline development involves the thorough review of: (i)
industry practices in the preparation of benefit-cost analyses; (ii) data
sources and methods for the estimation of direct and indirect damages (i.e.,
potential benefits); (iii) the impact of a changing climate on system
performance and vulnerability analysis; (iv) analysis methods to assess
performance; (v) life-cycle costs of storm drainage infrastructure; and (vi)
methods of comparing infrastructure alternatives. These foundational components
of the study are used to develop guidelines to assist municipalities and other agencies
with storm drainage responsibilities to prepare sound economic assessments in
order to identify worthwhile projects and prioritize investments. The
guidelines are intended to be flexible for applicability across Canada’s vast
geography and range of project and municipality scales, with their focus being on
direct and indirect tangible costs and benefits, primarily related to flooding.
Recognizing that storm drainage infrastructure can provide other additional
intangible co-benefits, NRC has engaged others to consider social and
environmental aspects.
This
paper will focus on the component of the work concerned with the available data
sources and methods for estimating damages, noting that the reduction of
damages due to infrastructure investment represents the benefits to society and
the numerator in the benefit-cost ratio, a metric which is used to assess
funding applications by certain agencies. This will include a discussion of high-level
“top-down” and local “bottom-up” approaches, as well as the importance to
ensure that the results from each approach tie together reasonably well, rather
than to produce divergent outcomes. A description
of these data sources and application of the approaches in case studies is provided
in the following sections. Each approach
has its place in risk management frameworks and assessments, and each has
different needs in terms of the level of effort and investment required to
derive meaningful and actionable results. The details derived from the
project’s findings in relation to this topic will be presented and documented.
The
following sections present methodologies for i) estimating benefits (i.e.,
deriving top-down insured and overall flood losses and bottom-up direct damages
that represent potential benefits of flood mitigation infrastructure) and ii)
estimating costs (i.e., capital and operating costs of mitigation works). Also presented are the results of analyses applying
these methodologies in case studies i) examining infrastructure investment
budgeting across Canada and in an example municipality (City of Markham), and
ii) examining works to control basement flooding. The analyses consider flood control benefits
derived from reported losses and from synthetic depth-damage curves. They consider completed project costs and
derived unit costs, as well as estimated costs based on expected benefit-cost
ratios for infrastructure works. Conclusions,
including considerations for setting public policy and funding priorities for
infrastructure investments are provided.
METHODOLOGY
Application of Benefit-Cost Analysis in Water Resources
The WEAO 2019
Technical Conference paper titled An Economic
Analysis of Green v. Grey Infrastructure (Muir and Papa, 2019) presented the
history of benefit-cost Analysis (BCA) in water resources including example
applications in Canada. While analysis
considering monetized or quantified costs and benefits is mandatory for new
regulations based on Treasury Board of Canada Secretariat guidelines, and
regional riverine flood management projects have applied BCA for decades,
application to urban infrastructure projects has been limited.
More
recently, Infrastructure Canada’s Disaster Mitigation Adaptation Fund (DMAF) established
a minimum benefit-cost ratio of 2:1 for eligible projects (Infrastructure
Canada, 2018). Benefits represented averted damages and could include any
quantifiable socio-economic and environmental damages. However, no guidance was provided on the
economic damages to be considered, whether direct or indirect, insured or
uninsured, nor were resources for assessing benefits or costs (e.g., through
typical case study examples available).
A
review of BCAs conducted for several proposed DMAF urban drainage flood
mitigation projects indicated a range of top-down and bottom-up methods to
estimate damages that were then equated to potential benefits. National Resources Canada (NRCan) and Public
Safety Canada (PSC) (2017) draft guidelines on flood vulnerability functions described
three methods for estimating tangible damages as follows:
1. The
first entails an examination of the floodplain immediately after the water
recedes. If such estimates were available for every flood over a period of many
years, a damage-frequency curve could be created;
2. An
alternative method is to determine the damage caused by three or four recent
floods whose hydrologic frequency can be determined and a smooth damage
frequency curve plotted through these points; however, for most floodplains,
changes in land use with calendar time prevent direct usage of a
damage-frequency relationship from historical damages; and
3. The
third method entails hydrologically determining various flood elevations for
specific flood frequencies and deducing synthetically the damages that would
occur given these flood events. This analysis provides a synthetic
damage-frequency curve from which one can estimate average annual damages for a
given study area.”
The DMAF projects reviewed included
examples of Method #1 whereby recent damages and program costs were enumerated,
Method #2 whereby top-down annualized damages were scaled to a local
municipality or project area, and Method #3 whereby the bottom-up assessment of
property-by-property frequency event losses were integrated and aggregated to
derive project-wide annual damages.
The
DMAF project review revealed several limitations in data sources and analysis
methods that support NRC’s current guideline development. For example:
i)
the loss estimate for sewer
back-up in bottom-up assessments was often overestimated considering historical
losses;
ii)
bottom-up loss estimates using
synthetic depth-damage curves were not calibrated to actual incurred losses
from insurance industry data or disaster relief funding;
iii)
the quantitative assessment of
climate change impacts was not assessed (with the exception of sea level rise
impacts);
iv)
some losses were double-counted
(both top-down and bottom-up);
v)
the integration of event
damages to derive annualized losses was not consistently calculated;
vi)
there was inconsistent
consideration of overall losses beyond insured losses;
vii)
operation and maintenance costs
were not evaluated in most assessments;
viii)
present value discounting of
costs and benefits was not considered in most assessments;
ix)
effects of growth on future
damages and potential benefits was not considered in any assessments; and
x)
financing costs were not
considered in any assessments.
In
addition, avoided losses were assumed to be equal to total losses which is a
reasonable approximation for large riverine mitigation projects but less
reasonable for urban flood mitigation projects where infrastructure upgrades are
not likely to be 100% effective given other causes. Later sections present losses based on the
statistical analysis of recorded losses that may be used to derive top-down
estimates used to assess adaptation funding needs at a national, regional or
local scale, and be used to calibrate bottom-up estimates derived with
synthetic depth-damage curves.
Estimation of Potential Benefits and Adaptation Funding
(Total Cost)
Appropriate
investment in flood mitigation infrastructure is of interest at the national
and local levels as overall programs and strategies should be adequately funded
to be effective. The required overall
program investment cost can itself be supported through BCA, to ensure that
sufficient funding is secured for worthwhile projects (that also demonstrate
value through individual BCAs). In the
case of flood reduction benefits, the Office of the Parliamentary Budget
Officer reviewed past damages at a national scale to guide financial assistance
budgeting (2016). From 2005 to 2014, flood losses including insurance payments
plus disaster assistance for uninsured losses totaled $12,505M (2014 CAD), or
$1.25B per year – this may be considered NRCan/PSC Method #1, representing
national top-down damages. Using JBA
Risk Management flood models and exposure data (i.e., building replacement
cost) from Brookfield RPS, the Insurance Bureau of Canada (IBC) estimated Canada-wide
property-by-property losses and total future annual losses of $2.43B – this may
be considered NRCan/PSC Method #3. Such
historical and projected modelled losses represent potential benefits of risk
reduction investments.
More
recently, the Federation of Canadian Municipalities (FCM) and IBC estimated the
“investment in municipal infrastructure and local adaptation measures needed to
reduce the impacts of climate change in Canada” (FCM and IBC, 2019). Adaptation costs for 34 communities to
address a range of perils including flooding were compiled and scaled across
the country according to GDP. Analysis
determined that an average annual investment in municipal infrastructure and
local adaptation measures of $5.3B was required. FCM and IBC recommended sustained federal
funding of a minimum of $1B per year for twenty years (IBC, 2019). The total adaptation cost over twenty years
is $106B with a minimum of $20B of federal funding. With a cited benefit-cost ratio of 6:1, the
annualized benefits would be six times the adaptation cost (i.e., $636B in
total and $6.36B per year, assuming a 100 year service life of infrastructure
investments and excluding ongoing operation and maintenance costs as well as
the time value of money).
The
above examples illustrate the wide range of potential annual benefits
considering recent reported losses ($1.25B), projected model losses ($2.43B),
and losses based on scaled adaptation costs and an assumed benefit-cost ratio
($6.36B). A disclaimer in the 2016 Parliamentary
Budget Officer report notes that “actual losses from catastrophic events may
differ from the results of simulation analyses” (i.e., the projected model
losses that consider empirical methods and the experience of scientists and
specialists). Furthermore, the “the accuracy of predictions depends largely on
the accuracy and quality of the data used by Library of Parliament.” Given the wide range of potential benefits,
and the uncertainty in modelled values, it is reasonable to expect that that modelled
losses could be calibrated to reported losses.
A subsequent section presents estimates of potential benefits based on
the statistical analysis of various types of reported losses. These values may be used to estimate the
range of national to local benefits of adaptation considered in top-down
assessments, and to calibrate modelled loss estimates derived in bottom-up
assessments.
Estimation of Adaptation Costs
The
cost of infrastructure investments to achieve adaptation benefits is estimated
throughout the planning and design process that identifies, prioritizes,
refines and implements projects, sometimes within an overall strategy or flood
control program. Various sources of
reliable information exists, particularly in relation to traditional (e.g.,
grey) infrastructure elements for which there is a long history, and the volume
and quality of data for more recent green infrastructure elements is steadily
improving. The focus of this paper is on
selected components relating to the estimation of benefits and, as such, the
discussion relating to costs is limited to this section. Whatever the case, the estimation of both
costs and benefits should be normalized to their discounted present values
and/or annual equivalents thereof for purposes of project evaluation and
comparisons amongst alternatives.
Potential Adaptation Benefits (Avoided Damages) Based on
Reported Losses
Muir
and Papa (2019) analyzed IBC’s Ontario water damage loss and loss expenses to
derive annualized losses in Ontario, equivalent to NRCan/PSC Method #2. Province-wide losses, or expected annual
damages (EAD), were scaled to the City of Markham, representing a top-down
approach to estimate potential flood control program benefits. Avoided damages were assumed to be equivalent
to insured losses, recognizing that overall losses are higher than insured
losses but that mitigation measures may only be partially effective.
As
IBC losses are not adjusted for GDP and do no identify losses beyond insured
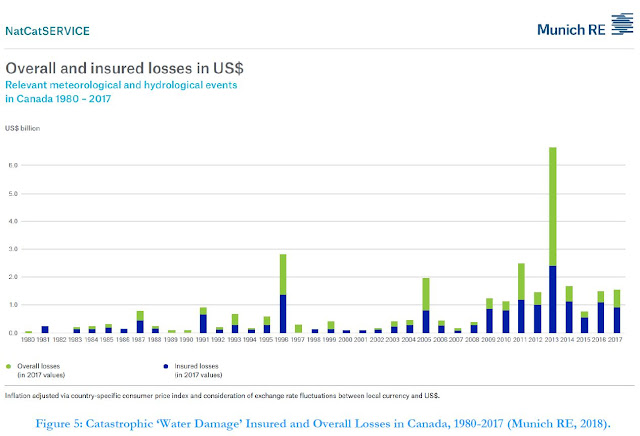
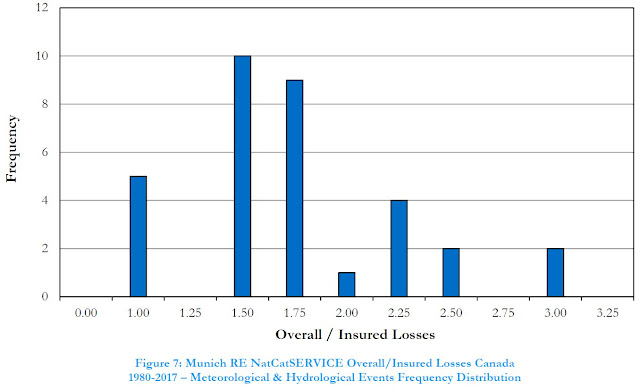
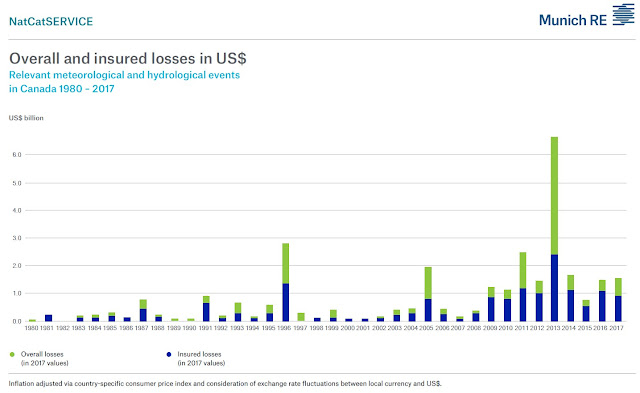
losses, other data sources may be considered to derive EAD values. Munich RE is
a leading global provider of reinsurance, primary insurance and
insurance-related risk solutions that compiles GDP-adjusted insured and overall
losses. National EAD for insured losses
and overall losses were derived using historical losses from 1980 to 2017
obtained through Munich RE’s NatCatSERVICE.
Figure 1 illustrates theses value for hydrological and meteorological
events, normalized for GDP growth, and expressed in 2017 USD.
FIGURE 1. MUNICH RE INSURED AND OVERALL
LOSSES IN CANADA 1980 – 2017 (Munich Re, 2018)
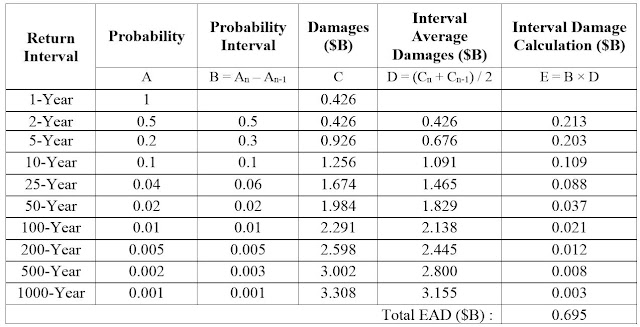
Values
were converted to 2017 CAD and a Gumbel (extreme value) probability density
function was derived to yield damage-frequency values, as per NRCan/PSC Method #2.
The EAD for insured losses was calculated by integrating the event losses,
resulting in a value of $0.695B as illustrated in Table 1. The method conservatively sets 1-year damages
to the derived 2-year damages. While 1-year
damages are expected to be less than 2-year damages, this approach can help
compensate for the fact that losses from smaller events are not reported.
TABLE 1. MUNICH RE CANADIAN INSURED
HYDROLOGICAL AND METEOROLOGICAL LOSSES, 2017 CAD – GUMBEL EXTREME VALUE DISTRIBUTION
AND EXPECTED ANNUAL DAMAGE (EAD)
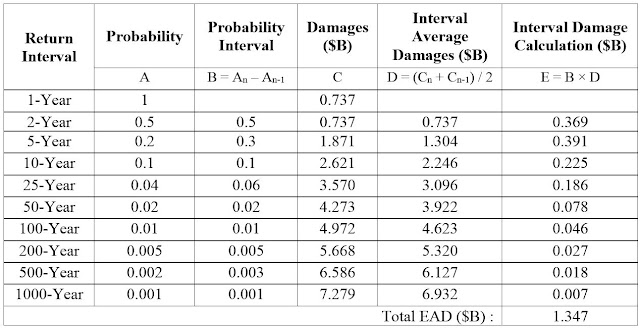
Overall
losses have been analyzed in a similar manner.
The EAD for overall losses is $1.347B as calculated from event damages
shown in Table 2.
While there is
variability from event-to-event, the ratio of overall-to-insured losses is 1.94
(i.e., $1.34B ÷ $0.695B), indicating that uninsured losses are comparable to
insured ones.
TABLE 2. MUNICH RE CANADIAN OVERALL
HYDROLOGICAL AND METEOROLOGICAL LOSSES, 2017 CAD – GUMBEL EXTREME VALUE DISTRIBUTION
AND EXPECTED ANNUAL DAMAGE (EAD)
The
regional distribution of losses including those associated with particular
flood event types can be assessed using the Catastrophe Indices and
Quantification Inc. (CatIQ) loss database.
CatIQ delivers detailed analytical and meteorological information on
Canadian natural and man-made catastrophes on a subscription basis to serve the
needs of the insurance / reinsurance industries, public sector and other
stakeholders. National EAD for urban
flood events was derived based on insured loss and loss expenses obtained
through CatIQ. This event type categorization
is unique from CatIQ’s broad Flood and Water peril classifications and is
intended to represent those events with a significant proportion of sewer
back-up/water damage within reported personal property damages. It is noted
that events may be characterized by multiple peril types, including Hail,
Windstorm, Winterstorm, and Fire; some water damages may occur primarily as a
result of other perils not related to extreme rainfall conditions (e.g., due to
power interruption disrupting sump pump operation, or wind damage to rooftops
allowing water entry).
Based on the foregoing, some Flood and
Water peril events may therefore be characterized by very limited water damage,
and would represent damages that cannot be mitigated through storm
infrastructure upgrades intended to address extreme rainfall conditions. Those events are excluded for the purpose of
urban flood event analysis, and are identified as those with a minimum of 30%
sewer back-up/water in overall personal property damages. As sewer back-up/water losses have been
discretized only since 2013 in the CatIQ database, the time series of losses
represents only part of the overall CatIQ dataset that begins in 2008, specifically
2013-2018. After filtering the data as
discussed above, the derived damage-frequency values and EAD are summarized in
Table 3.
TABLE
3. CATIQ CANADIAN URBAN FLOOD LOSSES, CAD – GUMBEL EXTREME VALUE DISTRIBUTION
AND EXPECTED ANNUAL DAMAGE (EAD)
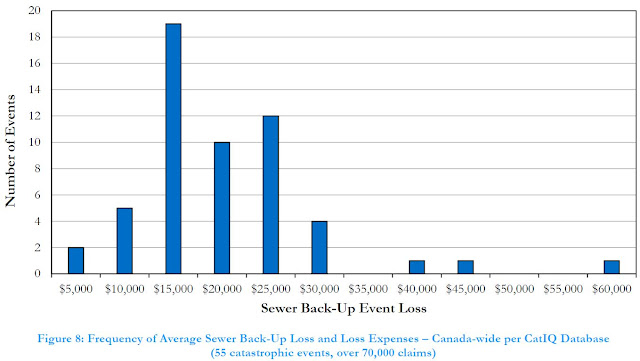
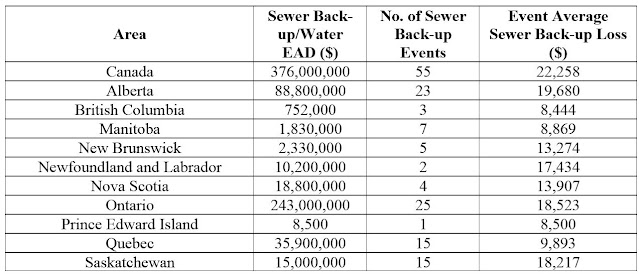
Sewer back-up/water losses represent a component of urban
flood event losses. On average these losses represent 70% of total event losses
for the urban flood events. The
component of total losses beyond sewer back-up/water include other personal
property, personal non-property, commercial and automobile line of business losses.
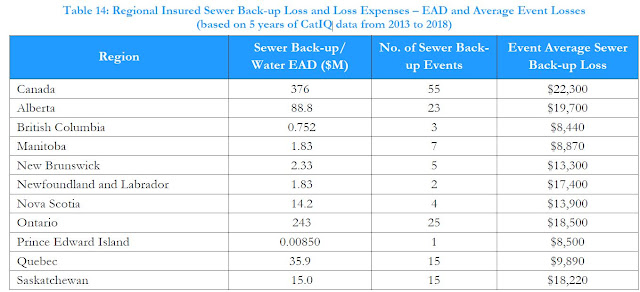
Table 4 summarizes derived damage-frequency values and EAD in Canada and in
provinces where CatIQ data is available.
The average sewer back-up loss is shown to vary across provinces and may
be used to calibrate losses derived from bottom-up damage assessments that
apply NRCan/PSC Method #3. For example,
where EAD is calculated by evaluating event losses for a range of return period
events in Method #3, the average EAD across many properties within a study area
or region should be comparable to the Event Average Sewer Back-up Loss in Table 4.
TABLE 4. CATIQ CANADIAN SEWER
BACK-UP/WATER LOSSES, CAD – GUMBEL EXTREME VALUE DISTRIBUTION AND EXPECTED
ANNUAL DAMAGE (EAD)
To summarize, national EAD values have been derived for various loss
types representing potential adaptation benefits. These are:
i)
Munich RE Hydrological and
Meteorological Events (1980-2017)
a.
EADMROL = Overall
Losses $1.347B ($2017 CDN)
b.
EADMRIL = Insured
Losses $0.695B ($2017 CDN)
ii)
CatIQ Urban Flood Events
(2013-2018)
a.
EADCIUF = Loss and
Loss Expenses $0.821B (CDN)
iii)
CatIQ Sewer Back-Up/Water (2013-2018)
a.
EADCISB = Loss and
Loss Expenses $0.376B (CDN)
Case studies in the Results section
illustrate how national and provincial losses may be scaled to local areas,
such as municipalities or project areas to support local damage estimation and
mitigation program budgeting, and to calibrate modelled national-level damages.
These will illustrate a top-down approach, based on the NRCan/PSC Method #2, to
derive losses, and will illustrate how they may be applied to calibrate
bottom-up damage estimates (i.e., NRCan/PSC Method #3).
Assessment of Regional and Local Flood Damages
National
and regional EAD values may be scaled to more local areas based on economic,
demographic, housing and infrastructure factors that have been shown to be closely
correlated at a provincial scale (i.e., GDP, population, dwelling count, and
sewer infrastructure length and value) and that have also been shown to be correlated
to provincial long-term losses in Ontario.
Such factors are commonly cited as influencing damages and therefore
global values are often normalized by these factors, such as by exposed
population and GDP (Formetta, 2019). Klotzbach et
al. (2018) examined damage trends as a function of population, housing
units, and wealth (GDP) in the continental US.
The assessment of disaster assistance trends in Canada’s Office of the Parliamentary
Budget Officer (PBO, 2016) adjusted historical payouts by GDP growth and
acknowledged that when population increases “losses will be greater” and that
as GDP per capita increases “this increases losses in a natural disaster.”
TABLE
5. REGIONAL ECONOMIC, DEMOGRAPHIC, HOUSING AND INFRASTRUCTURE INDICATORS
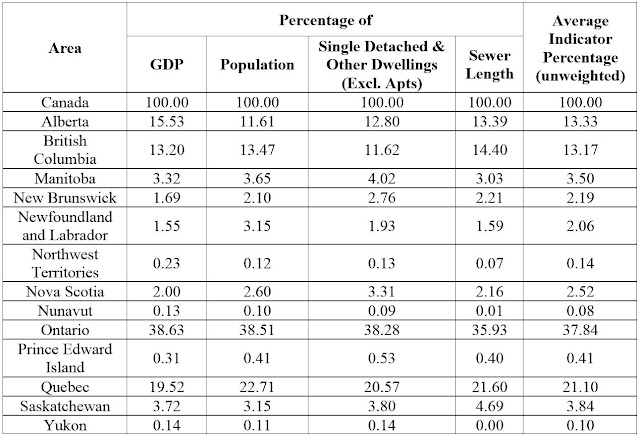
A
case study in the Results section illustrates how the above provincial losses
may be scaled to a municipality or project area to support the calibration or
verification of bottom-up damage estimates based on NRCan/PSC’s Method #3.
Potential Adaptation Benefits (Avoided Damages) Based on
Synthetic Depth-Damage Curves
Synthetic
depth-damage curves have been applied in Canada for many decades to assess bottom-up,
property-by-property flood damages (i.e., NRCan/PSC Method #3). Curves have been updated and applied over
large areas to prioritize riverine flood risk reduction efforts (Government of
Alberta’s Provincial Flood Damage Assessment Study (IBI Group, 2015), Toronto
Flood Risk Ranking (Toronto and Region Conservation Authority, 2019)) and to
support the economic evaluation of risk reduction alternatives (e.g., City of
Calgary’s Flood Mitigation Options Assessment (IBI Group and Golder Associates,
2017)). The latter study noted that neither
“groundwater inundation nor flood damage estimates were fully validated or
calibrated to historic events, due to lack of data to complete such analysis”
and furthermore that “analysis conducted in this Study concluded that available
flood insurance data does not lend itself to any type of uniform recalibration
of depth-damage curves or flood damage modelling for a variety of reasons…” Depth-damage curves have been more recently used
to assess urban pluvial and sewer back-up damages as well (Sakshi, 2019). In the City of Surrey analysis, where buildings
are subject to both overland and storm sewer back-up, the damage value from
overland flooding overrides the back-up damages. Limitations of the analysis were noted to
include the quality of the input data, the presence of a direct connection to
the stormwater main (sewer), and the lack of calibration of the hydraulic model
with the economic loss model. Despite
the lack of historical calibration, it appears that damages estimated through
synthetic depth-damage curves are effective in the identification and ranking
of regional riverine flood management priorities and in the relative ranking of
riverine flood mitigation alternatives.
In an urban setting, such curves may also assist in the prioritization
of risk areas for further study (EPCOR, 2019), and be used to estimate relative
changes as a result of climate change effects on extreme weather statistics.
The Need for Calibration of Depth-Damage Curves
Where
more than a relative assessment of damages is required for prioritization, calibration
of depth-damage curves is recommended such that cumulative losses broadly reflect
recorded insured losses and estimated overall losses. Research in jurisdictions worldwide has shown
that damages estimated using synthetic depth-damage curves may not represent
actual reported losses without calibration.
An evaluation of loss methods in Australia noted “most of the synthetic
methodologies prepared for Australia are not calibrated with empirical loss data
or express the magnitude of damage in absolute monetary values” (Nafari, 2018). Nafari evaluated two depth-damage curve
methods (Geoscience Australia (GA) Depth-Damage Function and FEMA/USACE
Depth-Damage Function (USACE)) and has shown that observed losses in Australia
may be overestimated by a factor of almost 100%, considering a February 2012
flood event. A calibrated depth-damage
function, called FLFArs, predicted damages within the 95% confidence
interval of the reported losses. A case
study in Denmark (Olsen et. al, 2015)
concluded that insurance data can be used to calibrate inundation modelling
even though estimating individual damages is a challenge:
“…it is shown that with the present data we
can establish clear relationships between occurrences of claims and hazard maps
on a basis of integrated hazard simulation and vulnerability assessment. This suggests
that insurance data can be valuable for calibrating inundation modelling in
terms of frequency and location of flooding, even when acknowledging that it is
difficult to accurately identify the flooded properties, in particular for the
low hazard category. The estimation of damage costs for individual claims
remains a challenge in this study. Our results suggest that the main variation
in per claim costs can, perhaps, be better described using socioeconomic
variables in models of the value at risk in different households, rather than
simple rainfall event variables.”
The
Flood Damage Assessment, Literature
review and recommended procedure (Olesen et al., 2017) identified the need for detailed hydraulic
information for bottom-up assessments:
“The most complex damage model is the
micro-scale damage model, where flood loss is evaluated on an object level. To
use this model, detailed information about type and use of single buildings and
elements is needed. The model can therefore only be applied if such data exist
for the investigated area. The highly detailed model requires a great amount of
data, and is therefore only recommended if the level of detail of the hydraulic
simulation can match that of the damage assessment.”
The report also recommended the use of
average unit damages, independent of flood depth where “the available data does
not suggest that the consideration of further flood characteristics adds more
information to the study,” recommended unit cost approaches for pluvial
flooding, and recommended the use of “specific stage-depth damage curves for
the investigated area.”
A comparison of national recorded annual flood losses ($1.25B) and projected
model losses ($2.43B) suggests that calibration of model losses is warranted. While these model losses were not based on
conventional depth-damage curves, the empirical methods could be refined such
that the estimated total aggregated property damages are broadly in line with
the observed losses. Calibration of
losses on a property-by-property basis is not expected, but rather on the total
losses.
RESULTS
The
following case studies illustrate i) the application of top-down Method #2
damage estimates at a national and municipal scale to inform national and local
adaptation program funding, and ii) the calibration of bottom-up Method #3
damages for an urban infrastructure upgrade project using historical provincial
sewer back-up/water damage data.
National Flood Adaptation Funding
National
investments in disaster mitigation should be sufficient to address expected
damages through cost-effective projects.
This case study evaluates Canada-wide adaptation funding requirements
considering historical expected damage values, estimated benefit/damage ratios
that consider the cost effectiveness of mitigation projects, and estimated
benefit-cost ratios considering recent DMAF project funding applications and
international experience.
Damages
to be addressed were presented in the Methodology section, including EADMROL
and EADMRIL based on Munich RE Hydrological and Meteorological
Events data and EADCIUF based on CatIQ Urban Flood Events data. While the expected benefit-cost ratios vary
from project-to-project in an adaptation program, the overall ratio can be
estimated considering a review of international and national programs. The ECONADPAT program reported a benefit-cost
ratio of 4.1:1 for “hard flood control” (i.e., traditional grey infrastructure)
based on a wide survey of international programs (Kuik et al., 2016). A survey of
Canadian DMAF projects that required a minimum ratio of 2:1 revealed ratios
from 5.5:1 to 17:1. The FCM and IBC
suggested that a ratio of 6:1 could be achieved in a national adaptation
program. For this case study, the potential benefit-cost
ratio is assumed to be 6:1, while the actual benefit-cost is 4:1, considering
that mitigation measures may be only partially effective.
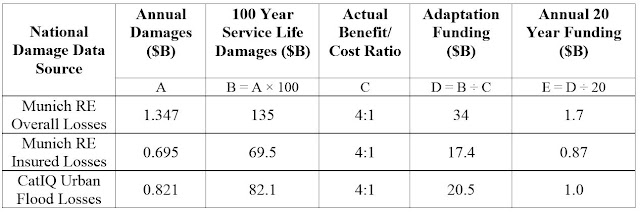
Table 6 summarizes damages, benefits and adaptation budget values based
on various EAD values and the assumed benefit-cost ratio. The service life of adaptation infrastructure
over which benefits are achieved is assumed to be 100 years. Total adaptation funding and annual funding
over a 20-year investment period is shown.
TABLE 6.
NATIONAL DAMAGES AND ADAPTATION FUNDING
Infrastructure
Canada has identified 59 eligible DMAF-eligible project costs (Infrastructure
Canada, 2020) totaling $4.0B, with program spending over 10 years, or
$0.4B/year on average. Based on expected
damages and benefits, annual funding of $0.87-1.7B, about two to four times
DMAF annual project investments, could be justified over twenty years based on
expected benefits of hard flood control projects.
City-Wide and Project-Scale Flood Control Program Funding
Municipalities in Canada
have pursued system-wide evaluation of risks and investment in adaptation
upgrades to address recurring flood damages. The City of Markham’s Flood
Control Program represents a system-wide flood risk reduction strategy that
focuses on storm sewer upgrades, but that also includes culvert upgrades and
floodplain reclamation / on-line storage (land purchase and use reassignment). The program cost is estimated to be up to
$368M (City of Markham, 2019).
City-wide benefits from infrastructure upgrades can be estimated by
scaling national damages to Ontario using the Table 5 scaling percentage (38%),
and to Markham based on the ratio of Ontario and Markham populations of 2.45%
(Muir and Papa, 2019) as follows:
i)
EADMROL-Ontario =
EADMROL × 0.38 = $512 M
ii)
EADMROL-Markham =
EADMROL × 0.0254 = $12.5 M
Benefits
in the Markham study and project implementation areas can be scaled from
city-wide values based on many approaches depending on available data,
including insurance risk ratings obtained through the city’s insurer,
hydrodynamic computer model surcharge risks (Xu and Muir, 2018), or based on
city-records of reported flooding. The fractions
of the West Thornhill study area and the Phase 1 project area flood reports to
city-wide reports are 39% and 6.1%, respectively.
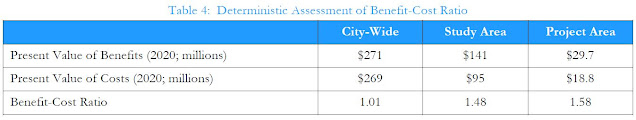
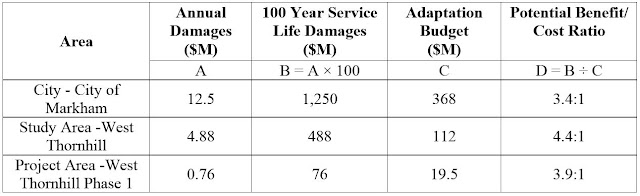
TABLE 7.
CITY-WIDE, STUDY AREA AND PROJECT-LEVEL DAMAGES AND EFFECTIVE
BENEFIT-COST RATIO FOR SEWER UPGRADES
Table
7 shows the study and project area costs.
Construction in the study area is 45% complete and the example project
area upgrades were completed in 2016.
The potential benefit-cost ratios for the city-wide program, study area
and project area range between 3.4:1 and 4.4:1.
While a few projects may be 100% effective at eliminating flood risk (e.g.,
floodplain reclamation), sewer upgrades may only be partially effective,
resulting in lower effective ratios on a project and city-wide basis. Where additional operation and maintenance
costs are added with new infrastructure, those ongoing costs would reduce the
effective ratio as well. As Markham’s
program involves primarily replacement of infrastructure, no new additional
operation and maintenance costs are expected.
For
new infrastructure, the operation and maintenance cost of storm sewers is
expected to be on average 0.05% and up to 0.2% of pipe value per year based on
National Water and Wastewater Benchmarking Initiative costs. That would add 5 to 20% to upgrade costs over
a 100 year period, reducing the effective benefit-cost ratio. Present value discounting of future benefits
would also reduce the ratio, given that costs are incurred up front and
benefits are realized up to 100 years into the future. By discounting at 3% per year, total
discounted benefits are 32% of total benefits.
While this may effectively reduce the benefit-cost ratio by approximately
one-third, the resulting ratio may still lie above 1, making the investment
worthwhile. Other factors affecting the
ratio include growth that may increase benefits over time and financing costs
that may reduce benefits. The
opportunity cost for Flood Control Program funding in the City of Markham was
2.9% in 2018 (City of Markham, 2018).
Sewer Back-Up Damage Estimate Calibration
A municipal sewer upgrade project estimated damages and potential
benefits considering bottom-up damage estimates derived from hydraulic model
results. The analysis cited an average
cost of a flooded basement of $43,000 in Ontario based on the reporting by the University
of Waterloo's Intact Centre on Climate Adaptation (ICCA, 2019). Analysis of CatIQ claim data from 2013 to
2018, including several extreme events, indicates a lower average value of
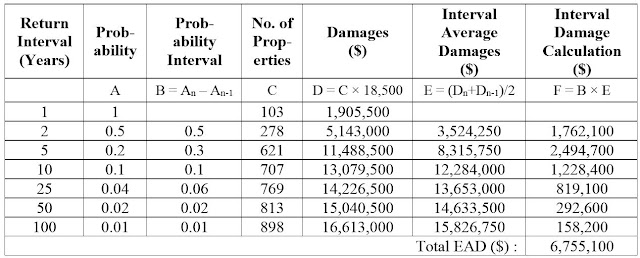
approximately $18,500 in Ontario, however, as shown in Table 4. Table 8 illustrates EAD values assuming an
average damage claim of $18,500 per flood event.
TABLE 8.
MUNICIPAL SEWER BACK-UP DAMAGE ESTIMATES
Applying
the estimated average loss of $43,000 results in an EAD of $15,700,400 which increases
the numerator in the project benefit-cost ratio by 230%. Of course, the benefits (numerator) should be
tempered somewhat as the effectiveness of the investment is likely to be less
than 100% efficient such that all basement flooding risk is completely
eliminated, but rather that the risk profile is changed for the better. As the municipality also considered estimated
losses of up to $100,000, reported losses and potential benefits are
considerably lower than estimated values.
While average event values are $18,500, more extreme events have been
shown to have a higher average loss compared to smaller, more frequent events. CONCLUSIONS
Reported
flood damage losses have been analyzed and can support the estimation of
overall adaptation funding requirements (i.e., mitigation infrastructure
investment) across Canada. Approved DMAF
disaster mitigation projects as of January 2020 have an estimated total cost of
$4.0B. To mitigate national expected
annual damages over the next 100 years, adaptation funding for hard flood
control measures of between $17B and $34B is warranted based on an expected
benefit/cost of 4:1 for such projects (ignoring any discounting effects). Current DMAF funding of $2B over a 10 year
period of 2018-2028 could therefore be expanded to support more extensive
adaptation efforts provided that eligible projects with suitable benefit-cost
ratios are available. With an
estimated value of wastewater and stormwater infrastructure in Canada of $368B,
an investment of $17-34B represents 5-9% of current asset value. As most assets were installed over a long
period covering the past 70 years, upgrades to infrastructure can be expected
to occur over decades. The case study
above demonstrates how Method #2 EAD estimates can be effectively applied,
leveraging reported historical flood damages, both insured and overall to guide
decision making on adaptation funding.
Investment
in adaptation infrastructure includes large regional works including diversions
and dams and also extensive municipal infrastructure upgrades. The level of funding for city-wide flood
control programs can be reviewed considering expected benefits and the
effective benefit-cost ratio at various scales including city-wide, high risk
study areas, and individual project areas.
The City of Markham Flood Control Program has been shown to have a
potential benefit-cost ratio of up to 3.4:1, with higher risk areas exhibiting even
higher ratios. The case study above
demonstrates a top-down approach leveraging Method #2 EAD estimates that are
scaled down to provincial, municipal, study and project area levels using
suitable proxies. Such scaling is
readily and reliably calculated using economic, demographic, development and infrastructure
statistics, as well as records data characterizing localized flood risks (e.g.,
municipal flood reports or hydraulic system performance results).
The average cost of a flood incident is an important statistic in BCA of
adaptation projects. Analyses that
consider property-scale damages have often used high-level estimates of costs
that do not consider local records that have previously not been available in
sufficient detail or duration. Analysis
of CatIQ datasets have provided provincial-scale average damage estimates that
may be used to calibrate bottom-up Method #3 analysis damage estimates. In Ontario, the average CatIQ sewer back-up
claim per event is approximately $18,500.
This value provides a lower damage estimate than higher values that have
been regularly applied in DMAF funding applications across Canada. To promote greater consistency in the
estimation of flood damages and potential benefits, reported losses should be
considered. This would support a more
reliable prioritization of projects based on relative benefits and would
support more reliable budget screening based on absolute benefit-cost ratios
that can be achieved.
BILBIOGRAPHY
City of Markham (2018) 2018 First Quarter
Investment Performance Review - Markham http://www2.markham.ca/markham/ccbs/indexfile/Agendas/2018/General/gc180507/2018%20Q1%20Investment%20Report%202.pdf
City of Markham (2019) Flood Control
Program and Stormwater Fee Update. https://pub-markham.escribemeetings.com/filestream.ashx?DocumentId=14144
EPCOR (2019) Stormwater Integrated Resource
Plan – Capital and Operational Plan Alternatives (May 2019 Utility Committee
report)
https://www.epcor.com/products-services/drainage/flood-mitigation/Documents/EPCOR_SIRP_May2019_Report.pdf
Formetta, G. (2019) Empirical evidence of
declining global vulnerability to climate-related hazards, Global Environmental
Change, Vol. 57 https://www.sciencedirect.com/science/article/pii/S0959378019300378
IBI Group (2015) Provincial Flood Damage
Assessment Study https://drive.google.com/open?id=1NNXxTrCKFVchjhcP6SJfJL-TS2WLcGuq
IBI Group and Golder Associates (2017)
Report, Flood Mitigation Options Assessment. https://drive.google.com/open?id=1I3LyK7rwbT1qtnLhQhqo9RzhXQ7j6Bho
Infrastructure Canada (2018) Disaster
Mitigation and Adaptation Fund - Applicant’s Guide, Strengthening the
Resilience of Canadian Communities, https://www.infrastructure.gc.ca/alt-format/pdf/dmaf-faac/dmaf-faac-guidelines-flat-e.pdf
Infrastructure
Canada (2020) Investing in Canada Plan Project Map, per Download Map Data (January
17, 2020) https://www.infrastructure.gc.ca/gmap-gcarte/index-eng.html
Insurance Bureau of Canada and Federation
of Canadian Municipalities (2019) Investing in Canada’s Future: The Cost of
Climate Adaptation http://assets.ibc.ca/Documents/Disaster/The-Cost-of-Climate-Adaptation-Summary-EN.pdf
Insurance Bureau of Canada (2019) New
report shows urgent need for climate adaptation investment http://www.ibc.ca/on/resources/media-centre/media-releases/new-report-shows-urgent-need-for-climate-adaptation-investment
Intact Centre on
Climate Adaptation (2019)Weathering the Storm: Developing a Canadian Standard
for Flood-Resilient Existing Communities. https://www.intactcentreclimateadaptation.ca/wp-content/uploads/2019/01/Weathering-the-Storm.pdf
Kuik, O. et al. (2016) Assessing the economic
case for adaptation to extreme events at different scales https://econadapt.eu/sites/default/files/docs/Deliverable%205-1%20approved%20for%20publishing_1.pdf
Klotzbach, P.J., Bowen, S.G., Pielke Jr.,
R., and Bell, M. (2018) Continental U.S. Hurricane Landfall Frequency and
Associated Damage Observations and Future Risks, American Meteorological
Society, Articles July, 2018, https://journals.ametsoc.org/doi/pdf/10.1175/BAMS-D-17-0184.1
National Resources Canada (NRCan), and
Public Safety Canada (PSC) (2017). Canadian Guidelines and Database of Flood
Vulnerability Functions, Draft.
http://hazuscanada.ca/sites/all/files/nrc-canadianguidelines-final_2017-03-30_draft.pdf
Office of the Parliamentary Budget Officer
(2016) Estimate of the Average Annual Cost for Disaster Financial Assistance
Arrangements due to Weather Events https://www.pbo-dpb.gc.ca/web/default/files/Documents/Reports/2016/DFAA/DFAA_EN.pdf
Olesen, L., Löwe, R., and Arnbjerg-Nielsen,
K (2017) The Flood Damage Assessment, Literature review and recommended
procedure https://drive.google.com/open?id=1-9hUAhILCxi_N_-vt4XbJWmZtB5E0P6L
Olsen, A. S., Zhou, Q., Linde, J.J,
Arnbjerg-Nielsen K (2015) Comparing Methods of Calculating Expected Annual
Damage in Urban Pluvial Flood Risk Assessments https://drive.google.com/open?id=1OOw7Ooia5FeinIleQDuKLYnH_RwoFXPd
Muir, R. and Papa, F. (2019) An Economic
Analysis of Green v. Grey Infrastructure, WEAO 2019 Technical Conference https://drive.google.com/open?id=1-DjFrp4KRfdjMAqGL091Bpb4oE0RbSVV
Nafari, R. H. (2018) Flood Damage
Assessment in Urban Areas https://drive.google.com/open?id=16sQza0QFZfnqoCMwt_nfZ3zT9Qc55heO
Sakshi, S. (2019) Risk and Return on
Investment Tool (RROIT) https://trieca.com/app/uploads/2019/03/3-1000-1030am-Sakshi-Saini-RROIT_for_trieca_public.pdf
Toronto and Region Conservation Authority
(2019) Toronto Flood Risk Ranking https://drive.google.com/open?id=1-5YWDEXDkbwKosjNydVqpJ23RLqaK8xx
Xu, L and Muir, R. (2018) Wastewater Collection
System Performance Under Climate Change – Safety Factors and Stress Tests for Flood
Risk Mitigation, WEAO 2018 Technical Conference. https://drive.google.com/open?id=1FZhM7DF5DLNm5Y0X3b3pn79jIk6yWFU7
***
Presentation: