Showing posts with label Environment and Climate Change Canada. Show all posts

Southern Ontario Extreme Rainfall Intensity Trends - Update From Environment Canada Engineering Climate Datasets

Environment and Climate Change Canada has updated and extended the Engineering Climate Datasets as noted in the last post. This post shows the updated trends in extreme rainfall intensities across long-term southern Ontario climate stations - the good news is that intensities have not increased. This means that infrastructure built in the last few decades is not undersized considering current rainfall design intensities.

Previously trends in some southern Ontario intensity-duration-frequency (IDF) values and annual maximum series were evaluated in my paper "Evidence Based Policy Gaps in Water Resources: Thinking Fast and Slow on Floods and Flow" in the Journal of Water Management Modelinghttps://www.chijournal.org/C449

Further analysis of trends in long-term stations has been presented in this blog and in the National Research Council of Canada's "National Guidelines on Undertaking a Comprehensive Analysis of Benefits, Costs and Uncertainties of Storm Drainage and Flood Control Infrastructure in a Changing Climate" - that guideline included trends in southern Ontario up to Version 3.10, as presented in the earlier post: https://www.cityfloodmap.com/2022/02/nrc-national-guidelines-on-flood.html

The southern Ontario IDF trend data has now been updated based on the Version 3.3 dataset released in May 2023 and includes some station updates to 2021- 9 of the 21 stations were updated. The following table and charts show the trends in 2-year to 100-year design rainfall intensities.

The table below shows changes in average intensity - decreases since 1990 are shaded in green and increases are in red. Note the the trends are weighted by record length. Across all durations and return periods the average decrease is - 0.33 %.  That is a slight decrease from the Version 3.20 datasets, meaning less intense rainfall when more recent data has been included. On average 30 statistics decreased while 20 statistics increased.


It is noteworthy that none of the 2-year intensities increased and the largest increase was 0.8% for 100-year intensities at one station for durations of 30 minutes and 1 hour. Overall for 21 stations 100-year intensities were virtually unchanged with the average intensities decreasing 0.1% after 30+ years, and the median increasing 0.2%. Skewed data statistics should increase over time with longer records - check out this post for more on that: https://www.cityfloodmap.com/2016/02/ontario-climate-change-trends-going.html


The following chart shows the range of changes for each return period as well as the average change. The decreases are greater than any increases for the 5 to 100-year events.


(note: above chart average intensity change dashed line corrected Nov. 10, 2024)

The following chart provides more of a breakdown by duration. One can see the red 5 minute intensities decreased on average for all return periods. The 2 hour to 24 hour intensities decreased for most return periods and where there were increase they were minor compared to other decreases. For the 5-year to 100-year return periods the 15 minutes to 1 hour intensities increased, but by no greater than 0.8%. These increases and decreases are basically insignificant in terms of impacts on infrastructure design.


This last table is annotated to show how various statistics are used in design. Infrastructure that has been designed considering short duration intensities like local sewer systems are now subject to virtually the same 2 to 10-year design intensities that existed over 30 years ago. Ponds designed for long duration higher return periods (e.g., 100-year events) are now subject to virtually the same intensities, or design event volumes, they were subject to decades ago as well. 


Environment Canada IDF Curve Update - Version 3.30 Release Adds Stations and Extends Data Records

Environment and Climate Change Canada has released the Version 3.30 of the Engineering Climate Datasets: https://collaboration.cmc.ec.gc.ca/cmc/climate/Engineer_Climate/IDF/

The number of stations and the length of average station record has increased with 276 updated stations, 38 new stations and 9 joined stations. This brings the total number of stations to 714, a significant increase relative to the time I started working.

The following table and charts illustrate how the number of stations and station-years of record have increased over time.

The number of "station-years" of data in the current data set (some data up to 2021) is 66% greater than the approximate number of station years in earlier data up to 1990. That is good to see.

Average record length is now up to 26.2 years, and the average 'last year' of data is just past 2007 (there are 3 stations that stopped in the 1940's, which brings the average last year down).


This chart shows how the number of stations and station-years of data have increased over the past several decades. Note that the years on the x-axis for 3.1, 3.2, and 3.3 are the respective release years (2019, 2021 and 2023), and not the newest data year included.


There have been suggestions that the number of stations has declined, adversely affecting the ability to assess changes in extreme rainfall intensities - see discussion in an earlier post https://www.cityfloodmap.com/2020/06/do-we-have-enough-climate-stations-in.html

Mekis et. al noted that the number "Manual" stations has declined as shown in the following chart - that can reflect the change in technology to automated stations that replaced manual stations (remember those analog strip charts?). The number of stations with IDF data has increased though, from only 532 stations in the 1990 data set to 714 now - a 34% increase. Those increases in station numbers are shown against the decrease in manual stations below. 


The average record length has been increasing overall as well (see table above), resulting in more reliable trend data today. Note that the addition of many new stations tends to pull the average record length down as shorter record length stations are factored in. Overall, more data is better and the new station records can extend over time.

Maximum Temperature Trends in Select Canadian Cities - Long-Term Trends from Environment and Climate Change Canada's AHCCD Dataset

A previous post reviewed Environment and Climate Change Canada's Adjusted Homogenized Canadian Climate Data (AHCCD) and temperature trends in Toronto and Ottawa. See post: https://www.cityfloodmap.com/2017/11/tvo-articles-on-climate-change-extreme.html

Temperature changes have been related to extreme rainfall changes, given the higher water holding capacity of warmer air.

This post presents more trends in annual maximum daily temperature at 12 cities across Canada. The AHCCD has recently been updated in 2020 - see summary here: https://www.canada.ca/en/environment-climate-change/services/climate-change/science-research-data/climate-trends-variability/adjusted-homogenized-canadian-data/surface-air-temperature.html

The following charts present the annual maximum temperatures (blue line) and 30-year moving average trends (grey line). Years with missing summer data have been removed. The selection of stations is based on those with long records but is not exhaustive. It is not clear if urban heat island effects could be a factor at these stations as well.

In Calgary the period up to the 1940's and 1950's was warmer (had higher maximum daily temperatures) that the most recent period:


In Chilliwack, temperatures have been fairly steady up until the periods ending in the 2000's after which some very high extremes have occurred:


In Fredericton the 30-year rolling average of maximum daily temperature has been increasing since the period ending in the 1930's, but has been decreasing since about 2000:

In Halifax, the average maximum temperatures here highest in the periods before about 1960, after which there was a drop. Since that drop the average has been increasing since 1990:


In Moncton, the average maximum temperatures have been relatively flat:

In Montreal, pre-1910 had lower daily maximum temperatures on average. Since the 1930's average maximum temperatures have been flat:


In Ottawa, the 30-year average has been decreasing since the late 1800's and early 1900's:


In Saskatoon, the 30-year average of maximum temperatures increased up to1940 and has been decreasing since then:


In St. John's, the daily maximum temperatures decreased in the late 1800's but overall have since been increasing, with a slight recent decrease:

In Vancouver, there appears to be a discontinuity in the data, with no trend up to 1930, a steep increase up to 1960, and generally flat (slightly increasing) trend since then:


Ross McKitrick, Department of Economics and Finance, University of Guelph, has commented on Vancouver temperature trends in the past (see July 2019 article in the Vancouver Sun - link: https://vancouversun.com/opinion/op-ed/ross-mckitrick-reality-check-there-is-no-climate-emergency-in-vancouver). He wrote:

"Temperature records for Vancouver begin in 1896. Looking at the 100 years from 1918 to 2018, February and September average daytime highs rose slightly, at about 1.5 degrees per century, while the other 10 months did not exhibit a statistically significant trend. Looking at the interval from 1938 forward, no month exhibits a significant upward trend in average daytime highs, in fact four months went down slightly. Looking at 1958 to the present, four months warmed slightly, but the annual average daytime high did not exhibit a significant trend." - the chart above supports this observation with annual maximum temperatures 'flat' since the late 1930's.

In Winnipeg, average maximum temperatures have been decreasing since the period ending in about 1950:


In Toronto, the trend is similar to Winnipeg - there were increases up to the periods ending in about the mid 1930's then a decrease: 


The previous post, based on data up to 2018, showed the trends in July daily maximum temperatures for other southern Ontario climate stations including Welland, Vineland, Hamlton, Belleville, Toronto and Peterborough. The trends included increases and decreases and an average increase of 0.17 degrees Celsius at these 6 stations:


Additional reading: Ross McKitrick has done a more thorough analysis of Canadian temperatures in his paper "Trends in Historical Daytime Highs in Canada 1888-2017" in 2018 (link: https://www.rossmckitrick.com/uploads/4/8/0/8/4808045/temp_report.pdf). He noted trends across Canada similar to those for southern Ontario above, writing "Since 1939 there has been virtually no change in the median July and August daytime highs across Canada, and October has cooled slightly."

Previous posts explored whether extreme rainfall intensities have increased in Canada - recent updates in Engineering Climate Datasets show no recent increase in 100-year design intensities and longer-term trends in southern Ontario stations have not shown increases in those extremes overall. It is possible that the lack of consistent increases in extreme temperature could be related to the trends in extreme rainfall - of course the charts above are limited to annual maximum daily temperatures and not longer-period temperatures that could also be influencing design rainfall intensities. 

***

How do you analyze temperature data in the AHCCD? 

Some manipulation of the raw AHCCD information is needed to determine annual maximum temperatures and to assess the 30-year trends charted above. The AHCCD data is provided in a compressed 'zip' file that contains individual files for each location, or climate station. Individual files are text files in ASCII format and are named after the climate station ID #. For example Toronto's station ID 6158355 has a data file called dx6158355.txt that looks like this:


This data file can be imported into an MS Excel worksheet and then be parsed, converting long text strings in column A to separate columns (use Text to Column function). Parsed data, with a column title added to the "data code" column after each day's maximum daily temperature data, would look like this:


Each row of data starting on Row 5 above represents the daily maximum temperatures in a single month. The maximum temperatures for each month can be calculated in column BN using the MAX function. For example, the red text shows maximum temperatures in each month (the maximum daily temperature across the row):


To determine the maximum temperature each year, the Excel Pivot Table function can be used. After selecting the column heading Row 4 and all data rows below and Columns A to BN, insert Pivot Table on a new worksheet. In the Pivot Table Fields window, drag "Annee" (year) into the Rows box and drag "Daily_max" into the Values box. The Values field will by default assign a sum function showing "Sum of Daily_max", summing all the monthly maximum temperatures in each year -  change that to a max function by clicking on the field and setting value field setting to "Max":


The result of the Pivot Table is shown below, with the maximum daily temperature determined for each year:


The annual maximum temperatures can be charted using an XY scatter plot in Excel. To create the 30-year moving average trend, insert a trendline (right click on the plotted line and select "Add a trendline").  Change the trendline type of moving average, specifying "Period" of 30 to average 30 years of annual maximum values (i.e., the overall maximum temperature climate trend for the prior 30 years). 

***

Extreme heat and trends can also be characterized using other statistics besides annual maximum temperatures reviewed above. For example, the number of days over a threshold value, such as 30 degrees Celsius, and that would be associated with stresses can be used as well.

The AHCCD data assessed above can be used to count the number of days in each month reaching over a threshold temperature, and those monthly counts can be summed for each year in the record. The example charts below show the number of days in each year with maximum temperature over 30 degrees Celsius. These charts also show the 30-year moving average of number of days over 30 degrees.

In Toronto, the average number of days over 30 degrees was highest many decades ago. The dashed black line shows this average and the ECCC AHCCD data shows that in the 30 years up to 1959 there were 14.9 days above 30 degrees, while in the 30 years up to 2020 there were fewer at 14.0 days a year. In the periods up to 1938-1941 the average number of extremely hot days was also high than the recent past, with 14.4 days above 30 degrees for those earlier periods: 


In Calgary, similar analysis shows that earlier periods were hottest. The 30 year average up to 2020 has an average number of days above 30 degrees of 4.8, compared to the period up to 1941 that had 6.1 days. The recent average of 4.8 days was exceeded in all the periods up to 1933 to 1955, and the periods up to 1986 to 1989 as well: 


CBC correcting claims on extreme weather trends since 2015 - more should follow their lead and more consistency is needed in CBC reporting

See the latest at the end of this post (Jan. 2021). The CBC has done a great job in correcting its reporting of extreme weather frequency claims over the years. Other media organizations like TVO and major newspapers have been given the same feedback on inaccurate reporting as CBC but have not moved to correct exaggerated claims. But while CBC has made may corrections, both voluntarily by its journalists and through the coaxing of its Radio-Canada Ombudsman, it has a tendency to repeat past inaccuracies without benefiting from what it has learned - so there is an opportunity to have the CBC be more consistent in its reporting, even adhering better to its own standards.

What are some examples of CBC's past corrections on extreme weather trends? Here are those that I helped move along.

1) November 2015

The CBC has corrected articles on this topic in the past as well dating back to 2015, confirming that there have been no changes in extreme rainfall. This correction was in response to a statement made by the insurance industry when an insurance broker stated we are having 20 times more storms today. This blog post describes the statement ""A lot of it has to do with the frequency of the storms and I think you could even extrapolate that it's got to do with climate change," ... "we're getting 20 times more storms now than we were 20 years ago." Here is a write-up on that exchange https://www.cityfloodmap.com/2015/10/bogus-statements-on-storms-in-cbcnewsca.html

CBC issued a correction and wrote me a letter dated Nov. 20 2015 (see excerpt in blog post link above and at right) saying "Environment Canada verified that there has been no significant change in rainfall events over several decades". In the article (link: https://www.cbc.ca/news/canada/windsor/more-than-half-of-homeowners-insurance-claims-stem-from-water-damage-broker-says-1.3291111) the correction is as follows:

"However, Environment Canada says it has recently looked at the trends in heavy rainfall events and there were "no significant changes" in the Windsor region between 1953 and 2012."

– this finding from 2015 is still valid today - a review of the updated Engineering Climate Datasets v3.0 released in March 2019 shows that across all of southern Ontario in fact observed rainfall intensities have been decreasing as engineering design “IDF” values have been decreasing as a result – this is shown for small frequency storms and large rare storms as well (see previous post on IDF trends, see previous post on decreasing annual maximum rainfall trends, see Stantec's review of Windsor Airport extreme rain trends in the December 2018 Windsor/Essex Region noted in this blog post and in the excerpt to the right - see "Conclusion: Short-term durations events are slightly trending downwards thus no evidence to increasing IDF curves for stormwater design").

2) January 2019

The recent CBC Ombudsman ruling [January 28, 2019] disputes statements made by Dr. Blair Feltmate of the Intact Centre on Climate Adaptation on the frequency of storms linked to flooding (100 Year storms).

See link to decision in English: https://drive.google.com/open?id=1o9nUurzw_SkONJTbdEEp9OysNjCVtLxa
Link to the decision in French: https://cbc.radio-canada.ca/fr/ombudsman/revisions/2019-01-28

This was in response to a story by CBC's Marc Montgomery that has been corrected: https://www.rcinet.ca/en/2019/01/30/how-to-mitigate-the-effects-and-flood-damage-from-climate-change/
And corrections to a counterpoint story where I was interviewed by Marc Montgomery and where I had brought up concerns with the accuracy of the initial story: https://www.rcinet.ca/en/2019/01/30/response-to-a-climate-change-story/

CBC originally stated “We are experiencing storms of greater magnitude, more volume of rain coming down over short periods of time these days due to climate change. That is causing massive flooding.” However  the CBC Ombudsman concludes that:

"One only had to examine the official Environment Canada data for Ontario as well as for the entire country to acknowledge that the claim made in the article was inaccurate. Such acknowledgement would at the same time have addressed the complainant’s criticism regarding the lack of data to corroborate Dr. Feltmate’s claim about the increased frequency of extreme rainfall events in Canada."

The Ombudsman also found that the CBC did not meet its own standards for accuracy and impartiality stating:

"Review by the Office of the Ombudsman, French Services, CBC/Radio-Canada of two complaints asserting that the articles by journalist Marc Montgomery entitled How to mitigate the effects of flood damage from climate change and Response to a climate change story, posted on September 19 and November 19, 2018, respectively by Radio Canada international (RCI), failed to comply with the CBC/Radio-Canada Journalistic Standards and Practices regarding accuracy and impartiality."

3) April 2019

The CBC corrected this article entitled "Canada warming at twice the global rate, leaked report finds"
https://www.cbc.ca/news/technology/canada-warming-at-twice-the-global-rate-leaked-report-finds-1.5079765 in April 2019. The article referenced Environment and Climate Change Canada’s (ECCC’s) Canada’s Changing Climate report https://changingclimate.ca/CCCR2019/ that reviewed extreme precipitation trends in Canada and stated:

"There do not appear to be detectable trends in short-duration extreme rainfall in Canada ..." and "For Canada as a whole, there is a lack of observational evidence of changes in daily and short-duration extreme precipitation.


The original article linked current flooding to changes in rainfall stating "Although flooding is often the result of many factors, more intense rainfall will increase urban flood risks."

I highlighted sections of the ECCC report stating lack of evidence of changes in rainfall extremes and as a result, this is the correction CBC made in response:

"Corrections, An earlier version of this story said that more intense rainfall contributes to increased urban flooding. In fact, while the report states that precipitation is higher overall, it did not find that episodes of short-duration extreme rainfall have increased or establish a connection between these and increased or exacerbated flooding. Apr 04, 2019 2:23 PM ET"

4) May 2019

In a April 11, 2019 CBC News article by Chris Arsenault entitled "“Canada's building code is getting a climate change rewrite. Is your home ready?” made the statement in the sub-headline “Increased flooding, wildfires and storms mean tough new rules take effect in 2025” which mischaracterizes trends in storms and flooding.

I shared the Ombudsman findings from January 2019, and CBC's earlier corrections on extreme rain trends. I also shared information on key causes of flooding, highlighting urbanization as a key factor per IPCC reporting, ECCC's Canada's changing climate report, local university studies and Ontario case law.

In response to this feedback CBC corrected the April 11, 2019 CBC News article per Paul Hambleton’s email to me on May 16, 2019. In response to the actual data showing no historical trends in extreme rainfall, CBC revised the sub-headline from “Increased flooding, wildfires and storms mean tough new rules take effect in 2025” to “Predicted increase in flooding, wildfires and storms means tough new rules take effect in 2025”.

This is now accurate - there have been no changes to date but there are predicted changes in the future. Canada's Minister of Environment and Climate Change Catherine McKenna has confirmed the lack of observed changes in extreme precipitation in a June 13, 2019 letter to me (see right).

In the letter she reiterates a statement made in Canada's Changing Climate Report stating: "the observational record has not yet shown evidence of consistent changes in short-duration precipitation extremes across the country" - The original report stated more simply (page 117):

"For Canada as a whole, observational evidence of changes in extreme precipitation amounts, accumulated over periods of a day or less, is lacking."


So bravo for CBC for making corrections to its reporting on extreme weather trends! No other media outlet has been receptive to making corrections based on feedback.  CBC's original corrections in 2015 are supported by new local and region data, and the recent corrections are supported by  Minister McKenna's recent statement and Environment and Climate Change Canada reporting. 

4) September 2019

The CBC Ombudsman Jack Nagler has reviewed the April 11, 2019 CBC News article regarding reported flood damages.  The Ombudsman's review is here entitled "Assessing the Damage".  It found that while there is uncertainty in how flood damages are estimated, considering direct and indirect costs (we agree), the article cited flood event costs that were plain "wrong" - the costs for a Toronto August 2018 flood event, supplied by the Intact Centre on Climate Adaptation, did not represent that event at all and related somehow to the July 8, 2013 event. The review reads:

"The $43,000 figure did not represent the Intact Centre’s estimate for the 2018 Toronto storm, but instead was their estimate for the 2013 Toronto storm"

The Ombudsman found a couple violations of CBC practices:

i) The wrong damage value for the August 2018 Toronto storm/flood
ii) Failing to document earlier corrections to the story (see point 3 above on those)

A key take away is this (my bold):

"I have a broader concern that there is a pattern of imprecision in CBC’s coverage relating to flood events. You provided me with a list of other recent CBC stories which make reference to the $43,000 damage estimate. Several confuse the matter by not indicating this is a specific estimate for the 2013 Toronto floods. One said, “The average basement flood in Ontario costs the homeowner $43,000.” Another said, “The average payout for a flooded basement is $43,000 and rising.”  These types of references take a single (and unusual) event in 2013 and treat it as if it is now a generic standard.

Reporters and editors need to ensure they understand what's included (and what's not) in any estimates provided, and they need to ensure that they associate that estimate with the correct event - or events, as the case may be. Based on my review, that is not happening consistently enough."

Me too on that broader concern.


***

Recent CBC coverage seems to go back and repeat the same inaccurate statements that have been made in the past and that have been corrected. Especially for extreme weather trends and their effect to flooding. Perhaps CBC needs to promote what it has already found on the topic of extreme weather trends and that could help it carry forward with more accurate reporting in the future?

Perhaps Ombudsman Jack Nagler's observation on the "pattern of imprecision", resulting in treating unusual events as standards (averages), will help improve CBC reporting related to flood events.

R. Muir

***

5) January 2021

NEW! : see Radio Canada's harsh new review of June 2020 reporting on extreme rainfall trends: 


Similar to the review in January 2019 described above, the Ombudsman has found additional violations of the broadcaster's JSP on the same topic by the same journalist - this has now resulted in Radio Canada management deleting the story that mistakenly 'confirmed' that extreme rainfall is more severe.

Is Wild Weather and a New Normal for Severe Rainfall Responsible for Urban Flooding, or Urbanization and Hydrologic Stresses? Case Law Points to Urbanization Driving Runoff and Flood Effects.

Everyone has an opinion on the weather and media is saturated with stories linking extreme weather with flooding. It makes sense. Flooding happens during severe storms. The bigger the storm the bigger the flood damages in fact.

But media and groups including the insurance industry and some researchers have suggested that flooding and flood losses have increased due to changes in weather patterns characterized by increased intensity or frequency of rainfall events.

That is not true. And there is no data to support that explanation.

Why?

Because rainfall intensities have not changed according to official Engineering Climate Datasets that review and analyze trends in extreme rainfall to inform engineering design across Canada.

Some media are correcting this false explanation that new wild weather, or a new normal, is causing flooding, like the CBC.

The CBC Ombudsman has ruled that CBC News reporting violated standards of journalistic practice in reporting more 100 Year storms linked to urban flooding - see the scathing report. It begins:

"Review by the Office of the Ombudsman, French Services, CBC/RadioCanada of two complaints asserting that the articles by journalist Marc Montgomery entitled How to mitigate the effects of flood damage from climate change and Response to a climate change story, posted on September 19 and November 19, 2018, respectively by Radio Canada international (RCI), failed to comply with the CBC/Radio-Canada Journalistic Standards and Practices regarding accuracy and impartiality."

and regarding this claim in the article on changing storm patterns:

“We are experiencing storms of greater magnitude, more volume of rain coming down over short periods of time these days due to climate change. That is causing massive flooding.”

the CBC Ombudsman concludes that (my bold):

"One only had to examine the official Environment Canada data for Ontario as well as for the
entire country to acknowledge that the claim made in the article was inaccurate. Such
acknowledgement would at the same time have addressed the complainant’s criticism regarding
the lack of data to corroborate Dr. Feltmate’s claim about the increased frequency of extreme
rainfall events in Canada."

While Environment and Climate Change Canada have refuted insurance industry claims on storm frequency shifts in the past (see Canadian Underwriter correction on the IBC/ICLR Telling the Weather Story theoretical shifts mistakenly reported as real data).

Yet the insurance industry has continued to promote the 'causation', with opinion pieces (not any peer-reviewed paper or analysis) saying climate-change effects on rainfall drive flood losses. See Financial Post piece

If not rainfall, what causes more flooding, more flood damages?

Canadian courts have pointed to urbanization as a driver, as in the landmark case of Scarborough Golf Country Club Ltd v City of Scarborough et al.. The decision indicates that urbanization markedly increases runoff stresses that cause runoff, erosion and flooding. Some highlights:

i) "Expert evidence confirmed the effect of the city's rapid urbanization and water control plans on the creek." 

ii) "It is important to note that the case is not presented primarily as a complaint against flooding but rather that the markedly increased flows and increased velocity of flow have caused and continue to cause damage to the creek bed and the adjacent tableland.", and 

iii) "There can be no doubt that the storm sewer facilities and urbanization of the lands to the north of the Club are the cause of the effects just described and that the difference in flow and velocity of flow is very substantial." 

So urbanization markedly increases runoff, flows and velocities, while there are no observed changes in extreme rainfall. Mapping clearly shows the significant expansion of urban areas in southern Ontario municipalities - see post and images below:


The IPCC has reviewed the size and frequency of floods at larger regional scales in their extreme events report and noted limited to medium information to assess changes, also noting the effects of changes in land use and engineering (see page 8):

"There is limited to medium evidence available to assess climate-driven observed changes in the magnitude and frequency of floods at regional scales because the available instrumental records of floods at gauge stations are limited in space and time, and because of confounding effects of changes in land use and engineering. Furthermore, there is low agreement in this evidence, and thus overall low confidence at the global scale regarding even the sign of these changes."

IPCC notes low confidence in the sign of changes at a global scale, meaning flood magnitudes could be going up or down.

Other factors driving losses? Research shows for some severe weather event types like hurricanes the driver is GDP growth, e.g., "research is robust in concluding that, for many decades into the future, the primary driver behind increasing economic losses related to hurricanes is expected to be societal growth"  

More factors? Maintenance of infrastructure affects its performance and flood risks. For example, TRCA described that flooding of the Keating Channel and lower Don River, which affects Toronto's Don Valley Parkway was due to a lack of maintenance:

"Since its construction between 1914 and 1922, the Keating Channel has been subject to heavy sediment loads, requiring regular dredging to maintain sufficient depths to allow for and maintain shipping activities at the mouth of the Don River. Between 1950 and 1970, widespread development throughout the Don Watershed and the construction of the Don Valley Parkway increased sedimentation rates by up to four times that of the pre-was era. After 1970, decreases in the number of new watershed disturbances and improved sediment control structures likely contributed to the decline in sedimentation in the Keating Channel to levels similar to the pre-war era. A reduction in shipping activities within the Keating Channel, combined with restrictions on the open water disposal of dredgate imposed by the International Joint Commission (IJC) in 1974, resulted in a cessation of dredging in the Keating Channel. In the following five to six years, the Keating channel filled with sediment and debris to the point where it became visible under all but high lake levels, resulting in increased flood risk along the lower Don."

So flood risks increase due to fluviogeomorphology (the transport and deposition of sediments in a watercourse) and hydraulics - when dredging stops, sediment builds up, hydraulic capacity is reduced and flooding is increased along the river. 

Yet despite flooding dating back to the 1800's, as reported in the Inquiry for Premier Davis, and despite impacts on rail lines in the Don River floodplain over decades, flooding has been attributed to climate change effects. Even by the 
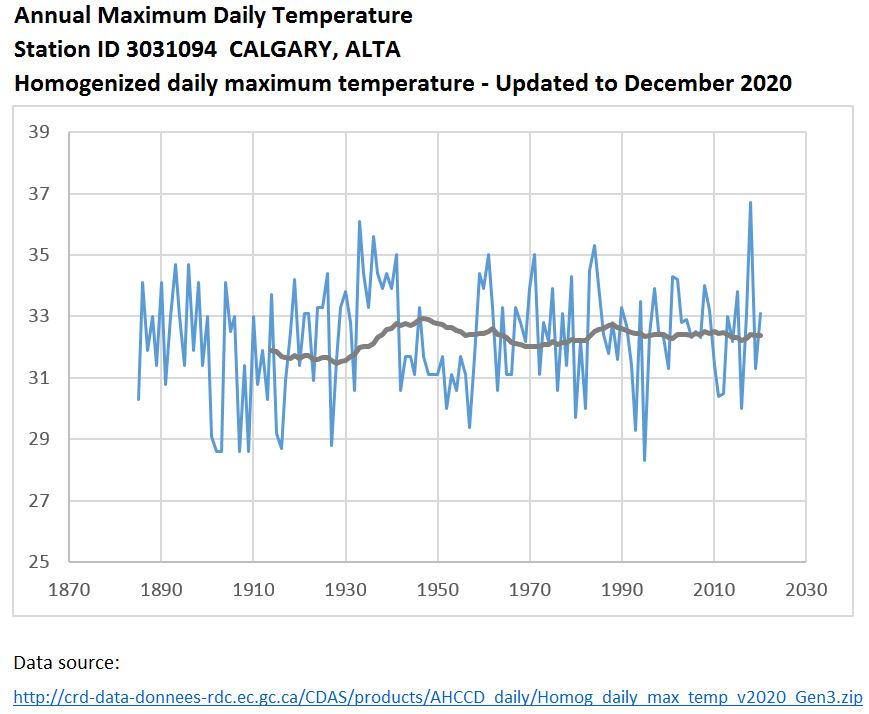
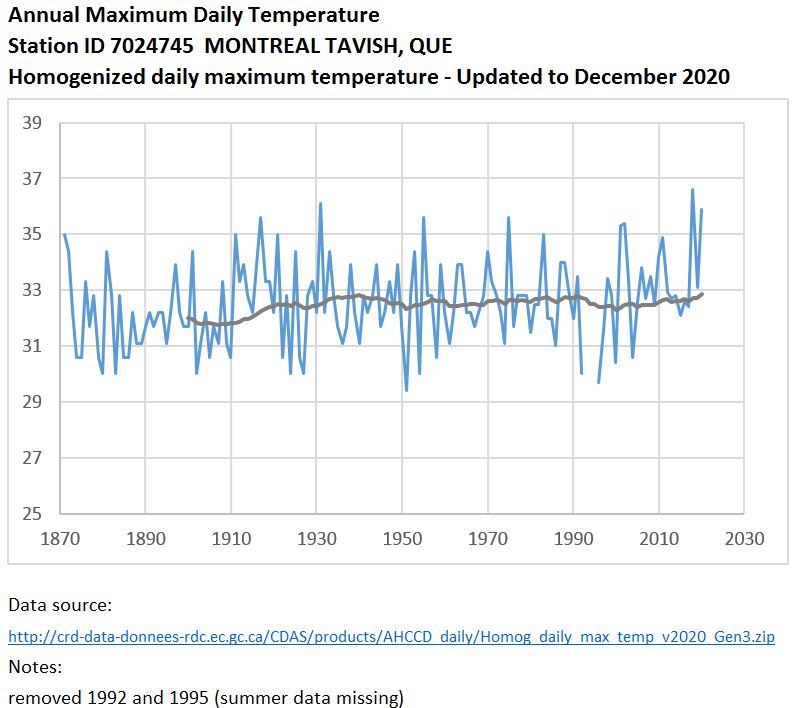
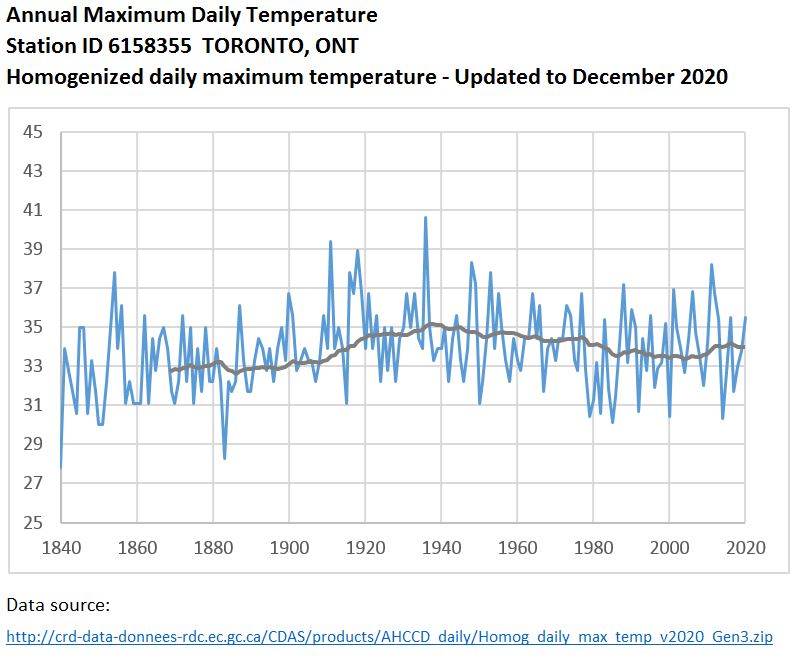
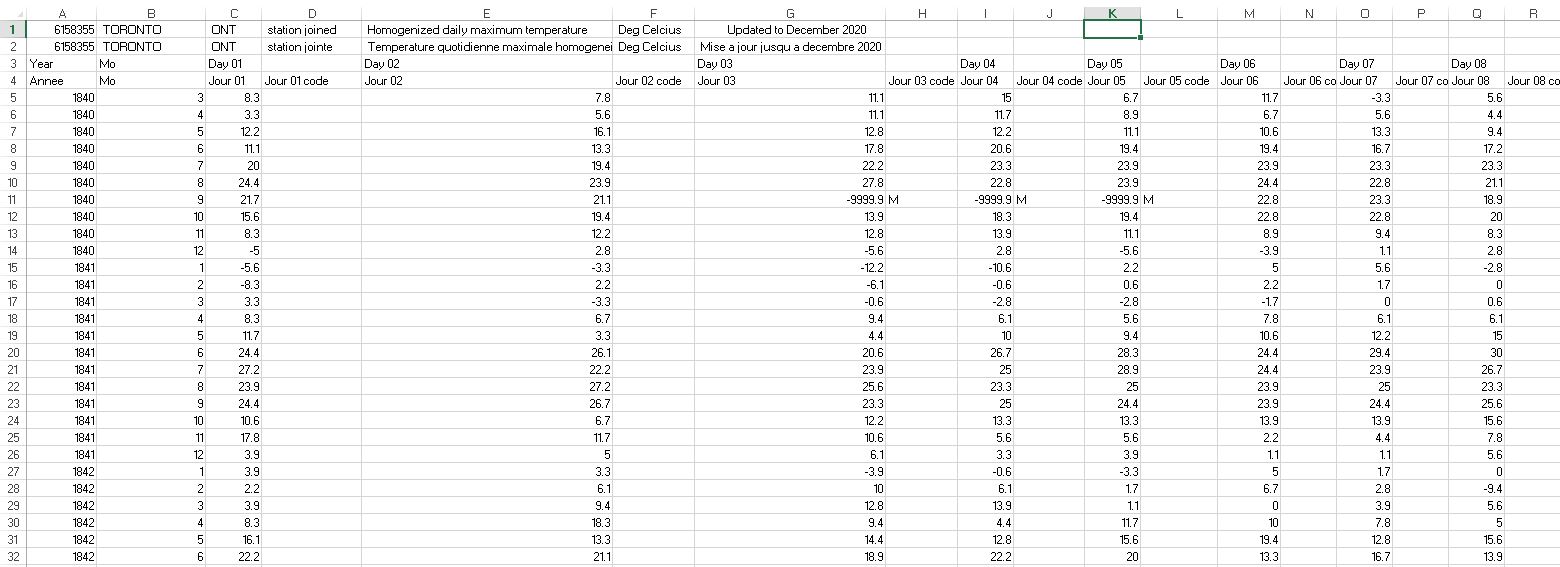
Environmental Commissioner of Ontario. The fact is there is no new normal with "wild weather", but the same old issues and extremes:


Hydraulics affect sewer system capacity and flood risks as well. Modifications to store sewage and prevent discharge to the environment can constrain capacity and contribute to higher back-up risks, as documented in approved Class Environmental Assessment Studies in Ontario. Call this "The Law of Conservation of Poop" - holding back sewage in the collection system to prevent overflows causes surcharge levels to rise, sometimes closer to basements, increasing basement flooding risks. The excerpt below from the Toronto Area 32 Municipal Class EA describes "Causes of Flooding" related to operation of the tanks installed to protect Lake Ontario and beach water quality:


And while stormwater runoff and sewage level are rising in storm and wastewater collection systems due to urbanization and hydraulic constraints, risks are being increased by lowering basements, exposing higher value finishing and contents to flood damages - in Toronto, the rate of basement lowering, tracked through Toronto Open Data building permits for foundation underpinning, has increased significantly as shown in this post. The chart below shows the data trends:


A new report "Canada’s Changing Climate Report" lead by Environment and Climate Change Canada confirms that there is no change in extreme rainfall in Canada based on observations (see Chapter 4) saying "There do not appear to be detectable trends ...":


This certainly contradicts claims made by an insurance industry-funded research group that have indicated there is 'a lot of data to show it' when it comes to bigger storms. A February, 8, 2018 presentation to the Standing Senate Committee on Energy, the Environment and Natural Resources included this statement:

"So when you see in the news and the media people talk about storms seem bigger and more intense and so forth, those perceptions are correct. And there's a lot of data to show it."

But a review in a recent presentation to the National Research Council's 2018 workshop on flooding that showed there is no data to support the statement. Concerns with insurance industry statements on frequency shifts were also expressed by Environment and Climate Change Canada staff in relation to the Telling the Weather Story 40 year to 6 year weather shift. Staff had concerns with statements that could confuse theory and actual changes. Here is an excerpt from communications regarding the Telling the Weather Story normal bell curve theory shift:

"The presentation looks to be a simple conceptual model for communicating the underlying idea – if one assumes a standard normal, then a shift in the mean implies an attendant change in extremes – which is fine as far as it goes. If this is used as the basis for statements about actual changes in extreme rainfall in Canada, then I would have concerns."

Here was the specific question posed:


Here is a graphic showing the theoretical shift in question, an arbitrary 1 standard deviation shift in a standard normal 'bell curve' (probability density function):


The Environment and Climate Change Canada report also speaks to theoretical shifts in probability density functions, like the Weather Story bell curve shift. This is the example showing a shift right in the distribution of extreme events Figure 4.2.1:

The reality is that in some regions when it comes to extreme rain intensities there is not a shift to the right but a shift to the left, meaning less extreme events, as shown in this annotated curve that reflects southern Ontario rain intensity shifts:


The 'green' shift to the left reflects an overall decrease of 0.4% in rainfall design intensities at 21 long term climate stations since 1990, considering durations related to urban flooding, i.e., 5 minutes to 24 hours. That analysis of the new Version 3.0 Engineering Climate Datasets was presented in this post.

There is often a statement that changes in means will lead to changes in extremes in a distribution of probabilities - this makes sense. This concept is reflected in IPCC reports as well:


But data shows that the means, the 2 Year storm rain intensities, the events that we have the most observations of and the most confidence in assessing trends are decreasing the most. The Version 3.0 datsets review for southern Ontario shows on average a drop of -0.8% in those rain intensities, as shown on this table in the first column:


In this region, the extremes can be expected to decrease along with the means - on average that is happening too for the 100 Year rain intensities.

The Environment and Climate Change Canada report notes 'medium confidence' in increases in annual precipitation across the country and "low confidence in quantifying regional or national total amounts of precipitation" - so medium confidence in it going up but low confidence in saying how much, especially at more local spatial scales, or regions.

Since little or no infrastructure is designed to address annual precipitation, the reports limitations on the annual precipitation statistic are irrelevant to cities facing challenges like urban flooding during extreme, short duration events. Based on CatIQ datasets, a higher number of flood claims and a higher value of claim is associated with rare storm volumes falling over duration of minutes and hours and not annual totals.

The key take-away is that extreme rainfall has not been observed to change, whether for higher frequency events like 2 Year storms, or for low frequency, rare events, like 100 Year storms.

It is easy for the media to confuse annual precipitation with rain extremes, and in the case of Canada’s Changing Climate Report, CBC News reported that urban flooding related to intense rain will increase too - CBC has since corrected that article noting the report did not find increased short-duration rainfall linked to basement flooding:


The Environment and Climate Change Canada report cites research that points to land use change having a "key role" in affecting flooding, for example for the southeast Prairies flood in 2014. Here is the excerpt on attribution of flooding to rainfall or other factors, saying "Anthropogenic influence may have influenced rainfall, but landscape modification played a key role in increased runoff":


This is consistent with reporting by the American Society of Civil Engineers who in their Adapting Infrastructure and Civil Engineering Practice to a Changing Climate document state: "It is important to point out that land-use changes (e.g., urbanization) can result in substantial flooding impacts, independent of climatic forcing functions." - see page 12.

Regarding attribution, it is also consistent with a recent report on extreme rainfall event attribution that also identifies a lack of association of extreme convective storms, those responsible for much urban flooding, with anthropogenic climate change effects. For example the National Academies of Sciences, Engineering, and Medicine. 2016 report Attribution of Extreme Weather Events in the Context of Climate Change states (see page 97):

"Studies of trends in the United States find different results depending on the time period and spatial region chosen, but there is no broad agreement on the detection of long-term trends in overall severe
convective storm activity such as might be related to anthropogenic climate change."

Regarding land use influence on runoff and flood risk, this is also consistent with analysis by the University of Guelph's Engineering Department on changes in urban 'runoff coefficients' (the fraction of rain that runs off and can contribute to flood stresses) due to urbanization like in the Don River watershed:


That analysis was intended to 'disentagle' the impacts of climate change and land use change. Green bars are pre-urbanization coefficients showing we had a small fraction of rain becoming runoff, while blue bars show significant increase in runoff potential after 50% urbanaization. Note there is uncertainty in flow monitoring too, just like in precipitation monitoring, but we see a 10 times, 1000% increase in runoff potential in summer months, when we have the highest rain intensities, due to urbanization. The urbanization effects are MASSIVE - the Scarborough Golf court case reiterated this fact over and over referring to "markedly increased flows".

Compared to urbanization effects on flows, meteorologic effects are a big "nothing burger", with no observed changes and just a lot of theory and speculation. We should design for uncertainty in the future, and incorporate cost-effective adaptation considerations or flexibility for future adaptation (ASCE's Observational Method for climate adaptation) however we should not mischaractierize past trends and risk factors driving today's infrastructure performance limitations.

The University of Guelph analysis also indicates that spring peak flow rates will decrease with climate change effects that reduce winter snowpacks and spring melt flood potential. The follow chart shows the decrease in spring peaks in the rural Moira River watershed:


The Environment and Climate Change Canada report recognizes the impacts of temperature on snow patterns in Chapter 4: "As temperatures increase, there will continue to be a shift from snow to rain in the spring and fall seasons.". The report also cites research that "The reduction in spring snow pack and the ensuing reduction in summer streamflow in British Columbia have been attributed to anthropogenic climate change". Other cited research notes "Such a change in the form of precipitation, from snow to rain, has profound impacts in other components of the physical environment, such as river flow, with the spring freshet becoming significantly earlier." - the University of Guelph research shows that the winter period flows increase from November to early March in the Moira River example, and the peaks decrease significantly from late March and April. This decrease in peaks will result in a decrease in spring flood risks in watershed affected by such events.

So there is no new wild weather, or new normal driving flood damages. Case law in Ontario defining the effects of hydrology, or urbanization, findings of inquiries into Don River flooding for Premier Davis, Municipal Class Environmental Assessment studies investigating basement flooding causes and solutions, and Environment and Climate Change Canada's Engineering Climate Datasets that examine trends in observed rainfall intensities show us that hydrology, hydraulics, fluviogeomorphology explain today's flood risks, and there is has been no shift in rainfall intensities, despite median and insurance industry 'weather stories' and claims.


Environment Canada Report Confirms No Overall Change in Extreme Rainfall - Generally Random Ups and Downs - Stated Certainty of Future Shifts Contradicts American Society of Civil Engineer's "Significant Uncertainty"

A new Environment and Climate Change Canada (ECCC) report Canada’s Changing Climate Report https://changingclimate.ca/CCCR2019/ reviews past, observed rainfall extremes https://changingclimate.ca/CCCR2019/chapter/4-0/ and confirms there are no observed changes in extreme rainfall across the country:

"For Canada as a whole, there is a lack of observational evidence of changes in daily and short-duration extreme precipitation."

ECCC predicts increases showing a theoretical probability density function shift (Figure 4.21) where the blue line probability density function represents today's/yesterday's eventt magnitudes and frequencies without climate effects, and red represents with effects (shift right means higher magnitude for any frequency):


Engineering Climate Datasets in some regions show trends in the magnitude of rain intensity magnitudes (reality) going the other way however:
https://www.cityfloodmap.com/2019/03/idf-updates-for-southern-ontario-show.html .

This image shows the difference between the theory and the local data reality - the green line is the REALITY showing for any given frequency (2, 10, 50, 100 Year events) the magnitude is going down in southern Ontario:

ECCC suggests there is insufficient data to observe the changes in extremes expected: "Estimating changes in short-duration extreme precipitation at a point location is complex because of the lack of observations in many places and the discontinuous nature of precipitation at small scales." - while that MAY be accurate for extreme events that are rare and elusive, why do 2 Year rain intensities, derived from many, many yearly observations at all long term rain gauges, show the clearest decline, across all durations from 5 minutes to 24 hours?

Surely, we have DO enough point locations and observations to see the change in these small storms. But if these small frequent storm intensities are no higher with today's temperature shifts, why do we expect the extremes to be higher either? Data we do have shows in southern Ontario these 100 year intensities are 0.2% LOWER on average. So extremes are shifting shifting along with the means.... shifting lower.

A theoretical probability density function shift has been promoted in the past by ICLR and IBC in the 2012 Telling the Weather Story report:


This has been shown to be 'made-up' and not related to real data (ECCC IDF tables and charts mistakenly cited as the source of the 40 year to 6 year frequency shift) - this chart shows the theoretical 1 standard deviation shift widely circulated by IBC and real data shifts:

See the difference between theory and data? It is pretty clear.

Given the lack of past trends, and uncertainty in future noted in the ECCC report ("It is likely that extreme precipitation will increase in Canada in the future, although the magnitude of the increase is much more uncertain"), we must follow the American Society of Civil Engineer's recommended "Observational Method" approach see 2015 report Adapting Infrastructure and Civil Engineering Practice to a Changing Climate at http://theicnet.org/wp-content/uploads/2015/07/2015-07-ASCE-Practice-to-Climate-Change-2015.pdf, and also see https://ascelibrary.org/doi/book/10.1061/9780784415191?utm_campaign=PUB-20181023-COPRI%20Alert&utm_medium=email&utm_source=Eloqua# for the new 2018 manual on engineering practice Climate-Resilient Infrastructure, Adaptive Design and Risk Management.

The ASCE 2018 manual promotes incorporating any no-regret, now cost measures in design today considering most probable future conditions, and allowing design flexibility to adapt in the future if and when performance is shown to be inadequate or affected by future changes - this is a practical approach intended to avoid costly over-design, and over-investment in potentially unnecessary and cost-ineffective infrastructure today.

While the ASCE 2015 report notes the high degree of uncertainty "However, even though the scientific community agrees that climate is changing, there is significant uncertainty about the location, timing and magnitude of the changes over the lifetime of infrastructure."

In contrast, the ECCC report appears to asset a high degree of confidence in future changes saying "For Canada as a whole, there is a lack of observational evidence of changes in daily and short-duration extreme precipitation. This is not unexpected, as extreme precipitation response to anthropogenic climate change during the historical period would have been small relative to its natural variability, and as such, difficult to detect. However, in the future, daily extreme precipitation is projected to increase (high confidence). - how can ECCC assert high confidence when there are no observed trends? How can ECCC contradict ASCE's statement on high "signifcant uncertainty'?

ECCC reports that summer precipitation is expected to decrease: "Summer precipitation is projected to decrease over southern Canada under a high emission scenario toward the end of the 21st century, but only small changes are projected under a low emission scenario." - how can that be if the summer temperatures are going up? Does this not violate the Clausius-Clapeyron theory cited in the ECCC report states that "increased atmospheric water vapour in this part of the world should translate into more precipitation, according to our understanding of physical processes" - so that is a theory - what about the real data? What does it show? the Clausius-Clapeyron relationship does not stand up to scrutiny as shown in a previous post.

Given highest rainfall extreme are in the summer (see the work of Dr. Trevor Dickinson on seasonal extremes), a summer decrease in precipitation could potentially mean lower flood risks. The data for southern Ontario already show a decrease in the annual maximum series (reflecting lower means and typical 2 Year design intensities in derived IDF curves) and the extreme 100 Year design intensities are decreasing slightly as well.

Overall, many in the media have over-hyped concerns about changing rainfall severity. Data and ECCC's report shows there has been no change, beyond random fluctuation. Looking ahead the American Society of Civil Engineers indicates that future changes have "significant uncertainty"- this contracts the ECCC's statement on "high confidence" on future extremes.