The following paper was presented at the 2021 WEAO conference. The presentation is included at the bottom of the post. A pdf copy of the paper is available here: paper
National Guidelines
on Undertaking a Comprehensive Analysis of Benefits, Costs and Uncertainties of Storm Drainage and Flood Control Infrastructure in a Changing Climate
Fabian Papa*, M.A.Sc., M.B.A., P.Eng.,
FP&P HydraTek Inc., Robert J. Muir, M.A.Sc., P.Eng., City of
Markham, Yehuda Kleiner, Ph.D., P.Eng., National Research Council of Canada
*FP&P HydraTek Inc., 216 Chrislea
Road, Suite 204, Vaughan, Ontario L4L 8S5
INTRODUCTION
Following
more than two years of extensive research and stakeholder engagement, the
National Research Council of Canada (NRC) has recently completed the
development of a comprehensive resource for practitioners to assist in the
development of economic assessments of initiatives aimed at reducing flooding
damage to core public infrastructure assets.
The overall guidelines which bear the same title as this paper consists
of a “main” guideline document supported by several appendices of foundational
research, comprising over 700 pages in total.
The guidelines (NRC, 2021) were developed
in recognition of the need to harmonize and standardize the assessment of the
value of storm drainage and flood control infrastructure initiatives. The
benefits provided by these infrastructure initiatives include the value of future
avoided damages as well as direct and indirect co-benefits, such as enhanced
health, recreational and environmental value.
These benefits are compared to the costs associated with the
infrastructure initiatives whilst considering the various uncertainties
associated therewith, explicitly including those uncertainties associated with
a changing climate. While such analyses
are not uncommon in Canada, they have generally been limited to large-scale
projects or other special situations requiring significant levels of investment
and sophistication. In this light, these guidelines are intended to help
promote such practices for a broader range of projects and a broader range of
jurisdictions with varying degrees of sophistication as well as the quantity
and quality of available information relating to their assets.
These guidelines are intended to promote the rational assessment of
projects or initiatives, using rigorous analysis through an economic lens such
that competing projects or alternatives can be objectively assessed and
compared. Concepts such as the time
value of money, benefit estimation, life cycle costs, net present value, net
benefits, benefit-cost ratios, cost-effectiveness, sensitivity analyses and
probabilistic risk assessments are explicitly considered in the
guidelines. The application of these
concepts is demonstrated through five case studies that span a broad spectrum of
project or initiative types as well as scales.
This paper is intended to provide a brief synopsis of the guidelines,
and the reader is encouraged to obtain a copy of the complete
publicly-available document for additional details.
Organization of the Guidelines
The guidelines are organized into two components: (i) a main body
referred to as the Guidelines Document; and (ii) nine appendices consisting of
a comprehensive bibliography with over 300 entries followed by a glossary and
list of acronyms, the foundational research (discussed further below) and case
studies. The Guidelines Document itself
provides the reader with brief summaries of the salient findings of the
foundational research work, followed by a generalized approach to conducting
the economic assessments and relevant information for performing time value of
money calculations, estimating benefits and costs as well as assessing
uncertainties. As with any such
practice, it is evolving in nature and, while the fundamental concepts
generally do not change materially over time, the ability to apply these
concepts can change as the degree of available information expands and
improves. To this end, a brief section dealing
with considerations for future work concludes the Guidelines Document.
The extensive foundational research work is summarized as follows (with
the relevant appendix titles in bold typeface):
·
A Benefit-Cost Analysis
Industry Scan was undertaken to assess practices across Canada and
internationally to identify the state-of-the-art as well as limitations. Included with this work was the review and
assessment of several relatively recent applications made to Infrastructure
Canada’s Disaster Mitigation Adaptation Fund (DMAF) which, in turn, revealed
several issues related to the estimation of benefits and application of
benefit-cost analyses.
·
A thorough review of Direct
& Indirect Long Time Horizon Flood Damages reports and research studies
was undertaken in conjunction with a review of available insurance industry
data sets for purposes of estimating benefits (i.e., avoided damages) associated
with project or initiatives aimed at reducing flooding. While bottom-up estimation of avoided damages
is fairly common, damage estimation considering actual reported losses has not
been readily available – insurance industry claim data has been analyzed to
support such analysis.
It is not always sensible
or appropriate to apply bottom-up techniques when assessing certain project
types or scales. The ability to use
insurance industry data allows for top-down assessments and guidance on how
this is done is provided in this appendix.
Amongst the concepts covered in this portion of the research is that
related to the use of damage-probability relationships to derive the Expected
Annual Damages (EAD), also referred to as Annual Average Damages (AAD), being
an important value in the estimation of the overall present value of damages.
Table 1 provides the
results of the assessment of available insurance industry data in relation to
the value of sewer back-up. Losses per property may be applied to bottom-up
analyses., Aggregate EAD values, to be used in top-down analysis are provided
for flood-related losses as well as sewer back-up losses. Additional details are available in the
guidelines and its appendices, and it is expected that these values may
continue to be refined and updated over time as additional information becomes
available.
TABLE 1 – EVENT AVERAGE
SEWER BACK-UP LOSSES (PER PROPERTY) AND INSURED LOSS EAD VALUES (CAD 2018)
|
Jurisdiction
|
Event Average Sewer
Back-up Loss
(for bottom-up analysis)
|
Flood Loss EAD
(for top-down analysis)
|
Sewer Back-up/Water EAD
(for top-down analysis
|
|
|
|
(Millions)
|
(Millions)
|
|
Canada
|
$22,300
|
$819
|
$376
|
|
Alberta
|
$19,700
|
$414
|
$88.8
|
|
British Columbia
|
$8,440
|
$16.1
|
$0.752
|
|
Manitoba
|
$8,870
|
$14.2
|
$1.83
|
|
New Brunswick
|
$13,300
|
$7.32
|
$2.33
|
|
Newfoundland and Labrador
|
$17,400
|
$10.2
|
$1.83
|
|
Nova Scotia
|
$13,900
|
$18.9
|
$14.2
|
|
Ontario
|
$18,500
|
$289
|
$244
|
|
Prince Edward Island
|
$8,500
|
$0.222
|
$0.0085
|
|
Québec
|
$9,890
|
$90.4
|
$35.9
|
|
Saskatchewan
|
$18,200
|
$41.8
|
$15.0
|
The aggregate EAD values
may be scaled down to a municipal- or project-level to estimate existing
damages that could potentially be avoided in the future with the new
infrastructure under consideration. Details are provided in the case studies.
· The appendix Climate
Change & Flood Damage Considerations addresses issues related to
meteorological uncertainties. Potential changes in climate and meteorology have
the potential to significantly affect the shape of future damage-probability
relationship. This component of the research thoroughly reviews the available
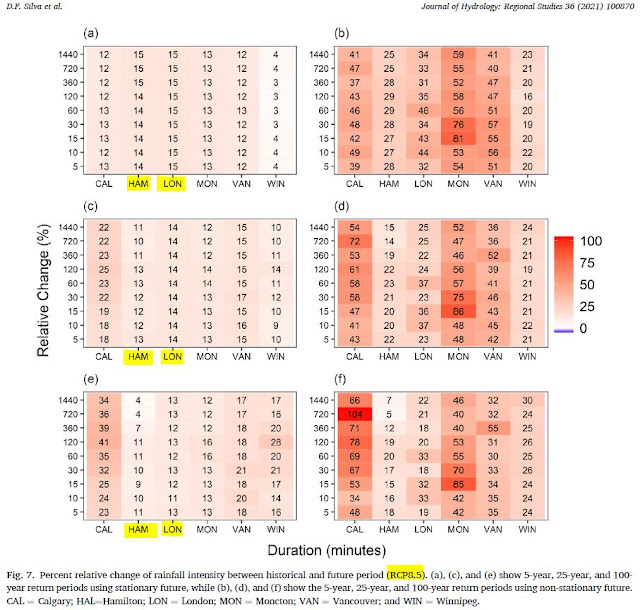
literature and data to give the reader a complete reference to consult. One of the important findings of this work
was the need to differentiate between short duration meteorological events (typically
less than 1 day and often on the order of hours) and long duration climate that
ranges from several days to more typically on the order of months, seasons or
years. Urban (pluvial) and sewer
surcharge-related flooding, where the majority of damages occur, is typically
driven by short-duration rainfall events and therefore, these deserve the
appropriate level of focus when considering projects at the more common scales
of sewersheds and municipalities.
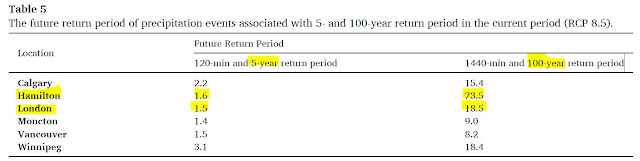
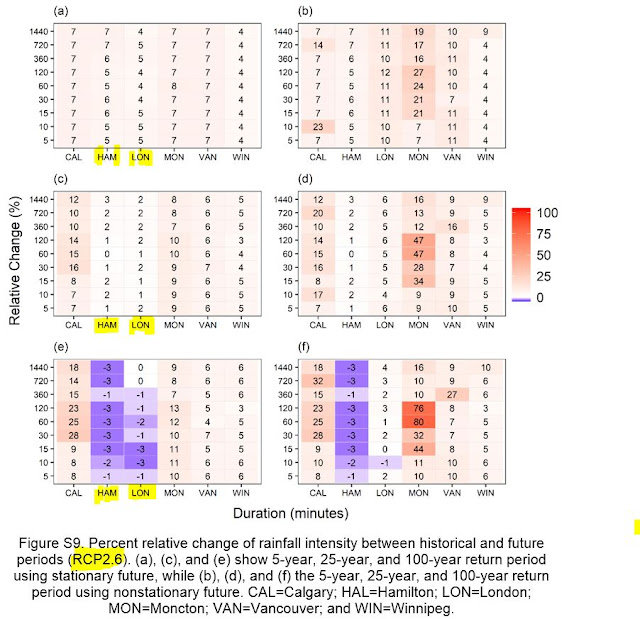
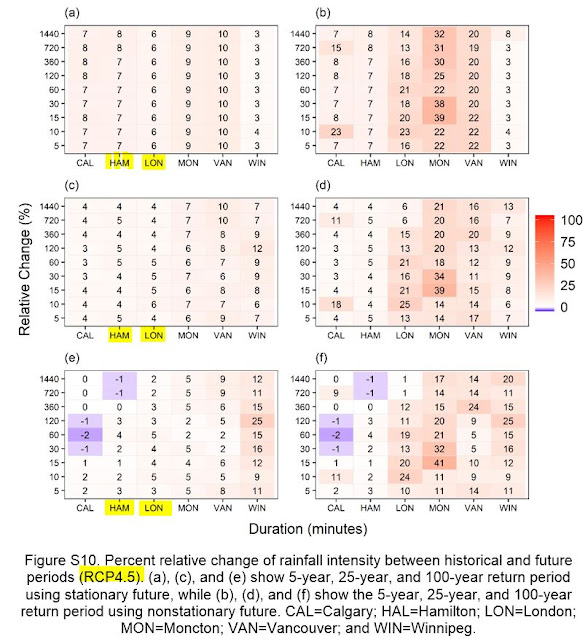
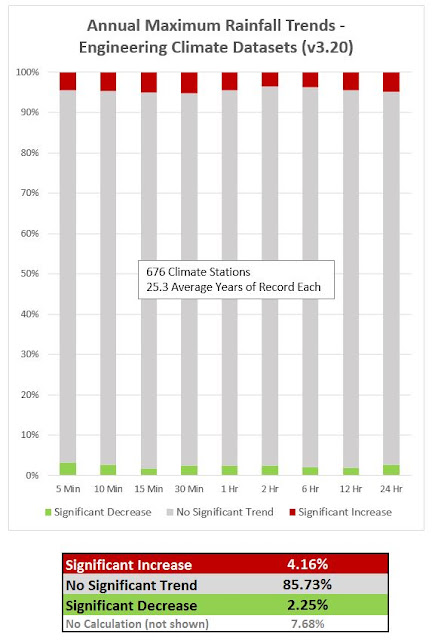
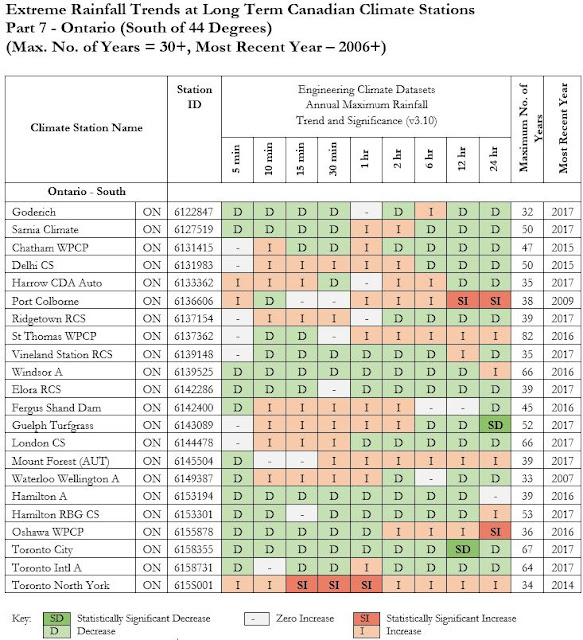
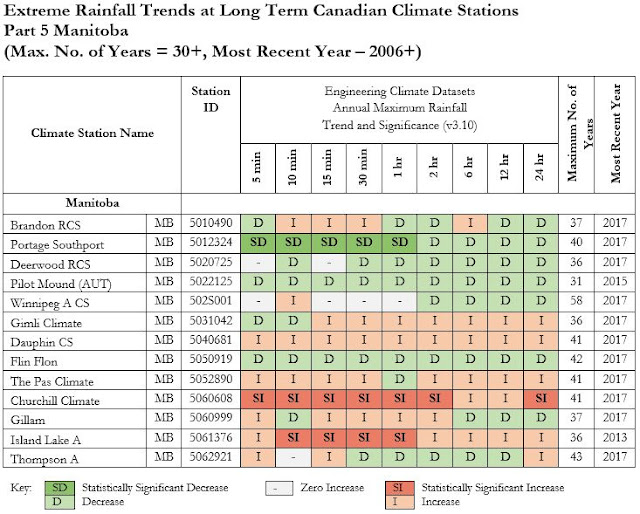
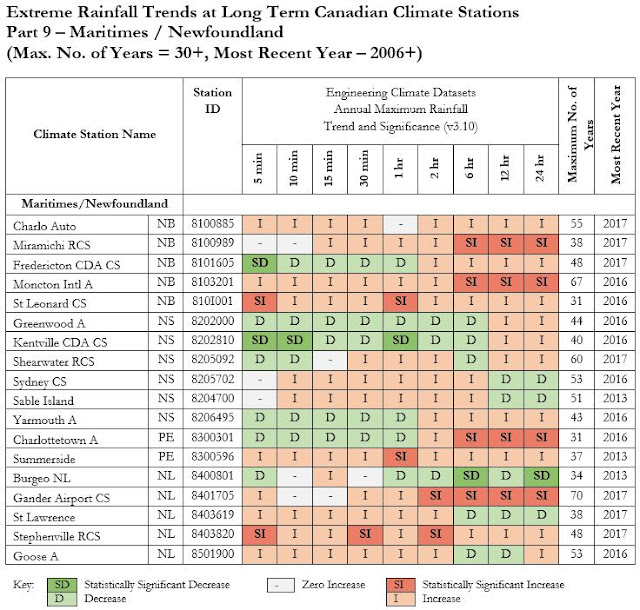
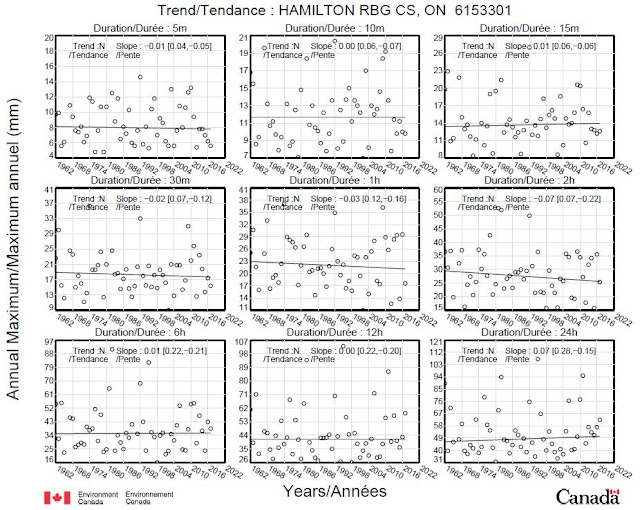
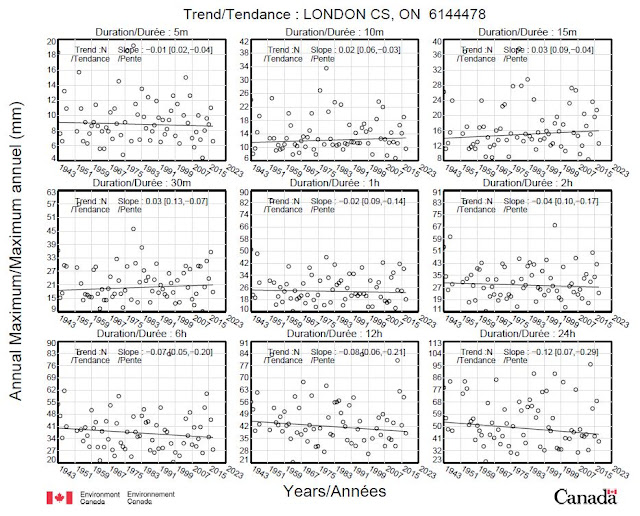
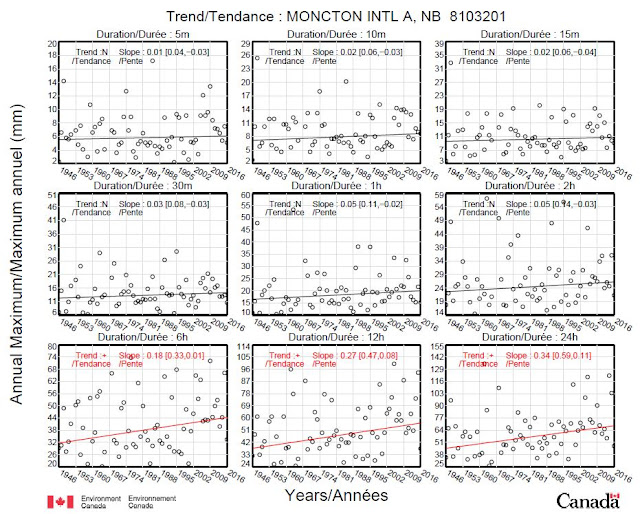
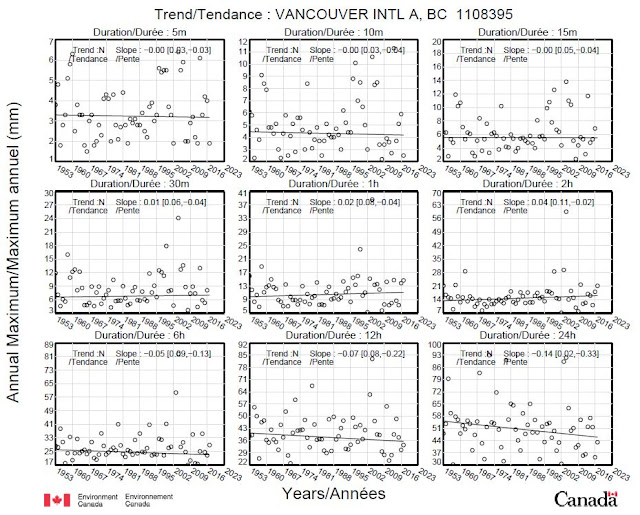
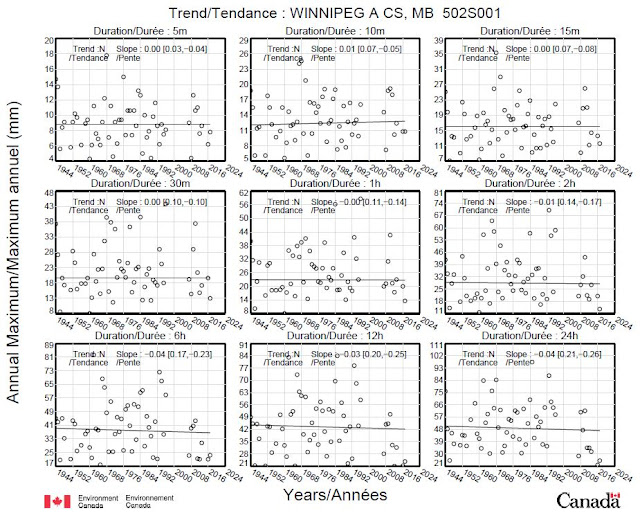
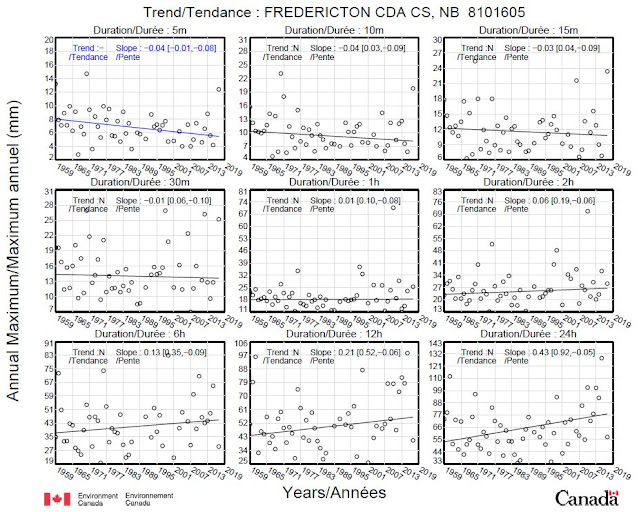
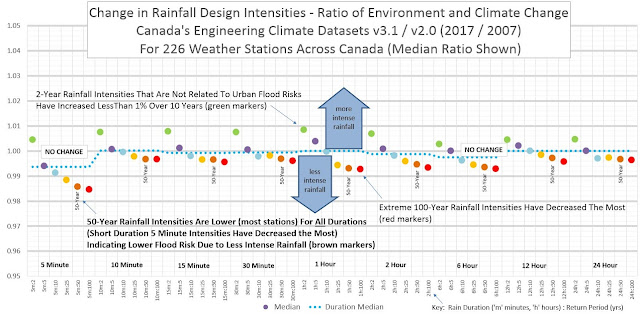
Environment and Climate Change Canada (ECCC) data relating to
short-duration rainfall trends was assessed in detail and found to (i) generally
not show strong overall signs of change in any direction (i.e., up or down),
and (ii) have a significant variation that is location-dependent. These observations regarding short duration
rainstorms are also corroborated in the literature (Shephard et al.,
2014; ECCC, 2020). Methods for
considering future climate conditions are reviewed, albeit with varying degrees
of uncertainty, and methods for dealing with such uncertainty are also identified.
·
It is important to recognize
that intangible benefits also accrue with any interventions that reduce the
likelihood and consequence of flooding.
Accounting for these additional benefits will have the effect of
improving the economic assessment of any intervention. The appendix titled Post-Flood Event
Economic, Legal, Social and Indirect Costs addresses matters related to
reductions in property values, human health impacts, population displacement,
disruption of (and stress on) municipal infrastructure services, and legal
costs. The appendix titled Post-Flood Event Environmental Impacts addresses
matters related to flood impacts such as erosion, quality of water in the
environment, impacts to flora and fauna and greenhouse gas emissions, among
others. It is worth noting that it is
often difficult, and sometimes impossible to monetize many of these
co-benefits. Nevertheless, the process
of identifying and (non-monetarily) quantifying such benefits is helpful in
striving for a comprehensive economic assessment and may be incorporated into
multi-criteria and/or triple bottom line analyses that can accompany the
monetarily-based economic assessments.
·
The appendix titled Life
Cycle Costs of Storm Drainage and Flood Control Infrastructure addresses an
area where the industry benefits from a considerable amount of data and
experience as such assessments, or at least components thereof, are routinely
conducted in relation to project selection, construction cost estimation,
construction contracting as well as asset management and financial
forecasting. In addition to basic
guidance on developing cost streams for time value of money calculations, an
abundance of cost estimating data and relationships is also provided to
facilitate this component of any economic assessment.
·
The overall document concludes
with an appendix consisting of five Case Studies which demonstrate the
application of the various concepts and methods promoted in the
guidelines. The case studies are largely
developed from actual projects of various types, scales and locations in Canada
in order to give the practitioner a sense of how such economic assessments may
be approached and conducted.
Although
the guidelines are the result of specific, deliberate and thorough research,
they are not to be construed as a prescriptive approach. Each opportunity to apply them needs to be
assessed based on its own particular circumstances, including the degree of
importance (i.e., value of initiative considered and/or risk associated with
infrastructure in question, including its criticality), the quantity and
quality of available information as well as the level of effort to acquire any
additional information and conduct supporting technical analyses (e.g.,
hydrologic and hydraulic modelling, depth-damage curve development, etc.),
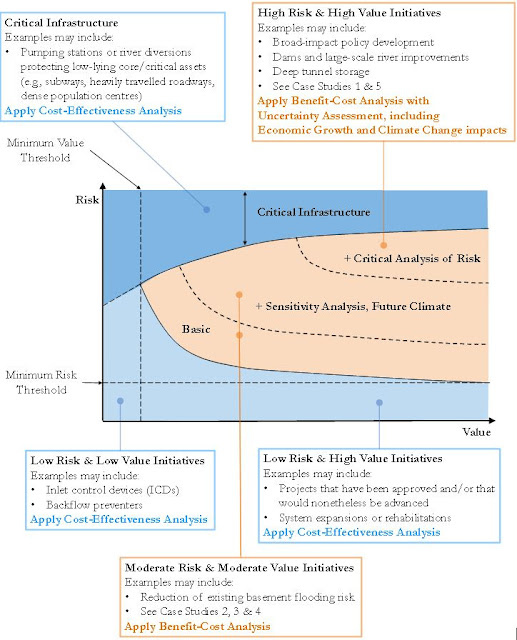
amongst other matters. To assist the
practitioner in identifying how to approach an analysis, a conceptual model is provided
in Figure 1.
FIGURE
1: CONCEPTUAL MODEL TO IDENTIFY ANALYSIS
METHODS TO CONSIDER WITH EXAMPLE APPLICATIONS
EXPECTED ANNUAL DAMAGES (EAD)
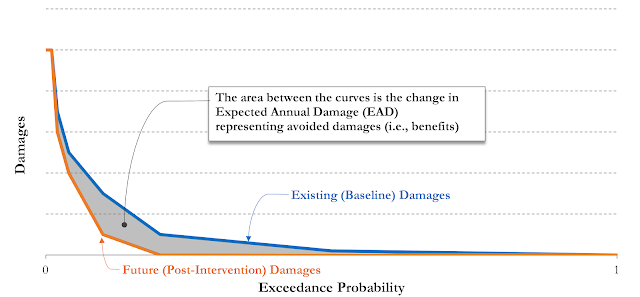
As noted earlier, the main benefit of any flood-control measure is the
value of the damages this measure is expected to avoid over the duration of its
service life. The high uncertainty that
is inherent in estimating future damages necessitates a probabilistic approach,
where damage from a flooding event is associated with the probability of
occurrence of this event. This is
illustrated graphically in Figure 2, and involves determining the area beneath
each of the damage-probability curves (i.e., both the existing curve and the
future, after the improvement project, curve) to arrive at the area between
these curves.
FIGURE
2: CONCEPTUAL CALCULATION OF EXPECTED
ANNUAL DAMAGES (EAD) AVOIDED AS A RESULT OF IMPROVEMENT PROJECT
While
this calculation seems straightforward enough, it could be complicated by the
fact that many relevant factors are not necessarily stationary over time. Matters such as economic growth, representing
the real (rather than nominal) value of the properties and assets that are
impacted by flooding that can be expected to grow over time as the overall
wealth of the society increases.
Further, climate change as well as increased urbanization may
potentially change the character of the relationship between damage and
probability. Changes in the value of
assets at risk of flooding (i.e., economic growth) will have the effect of
shifting the damage-probability curve vertically (i.e., positive growth will
result in an upward shift), while changes in climate, assumed to be represented
by changes in rainfall intensities for different return periods (or
probabilities of occurrence) will result in a horizontal shift (i.e.,
increasing rainfall intensities will result in a shift to the right). The combined impact of these changes, as well
as how EAD may change over time as a result thereof, is illustrated in Figure
3.
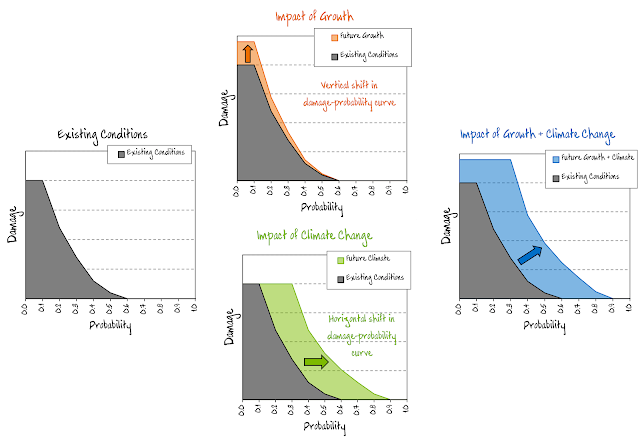
FIGURE
3: CONCEPTUALIZATION OF IMPACTS OF
ECONOMIC GROWTH AND POTENTIAL CLIMATE CHANGE
ON FUTURE DAMAGE ASSESSMENT
ASSESSING UNCERTAINTY
A
good forecaster is not smarter than everyone else,
he
merely has his ignorance better organized.
-
Anonymous
It is extremely important to acknowledge, understand and explicitly
consider the uncertainties inherent in any analysis, particularly given the
scale of investment and potential damage implications associated with storm
drainage and flood control infrastructure.
Ignoring these uncertainties may result in significant under- or
over-investment, yielding poor returns on investment and depriving society of
value by wasting resources that could otherwise be deployed for other, more
valuable, infrastructure improvements. The
impact of neglecting to account for uncertainty is magnified by the extremely
long service life of these infrastructure assets – typically in the order of
75-100 years.
Uncertainties
exist in relation to the estimation of baseline benefits and costs, as well as
in relation to potential changes in the benefits of avoided damages associated
with economic growth and potential climate change impacts. Additionally, the assumptions applied for the
time value of money calculations, including the discount rate and time horizon,
may play meaningful roles in changing the economic outlook of a project.
The
guidelines identify various methods for assessing uncertainty, including the
relatively simple application of sensitivity analysis and, as a subset thereof,
stress tests. Both of these types of
analyses have been adopted by various jurisdictions to help identify vulnerabilities
in existing or proposed infrastructure systems and allow for the allocation of additional
costs and efforts only where they are most needed. A more sophisticated method of dealing with
uncertainty covered in the guidelines include the application of the
probabilistically-based Monte Carlo analysis, where probability distributions
for each of the uncertainty-bearing parameters can be developed and applied to
produce a probability distribution for the output (e.g., benefit-cost ratio or
other outcome sought through the analysis).
The
guidelines also contain a discussion of Real Options Analysis, which is
expected to be particularly relevant to the intended audience given the
potential scale of investment required for certain projects aimed at reducing
flooding. This approach focuses on
adaptability and incorporates the ability to incorporate information as it
becomes available to help decide on the appropriate next step. It limits possible over-investment that may
result from high uncertainty, which in turn leads to over-estimation of the
severity of future conditions, whilst not constraining the ability to implement
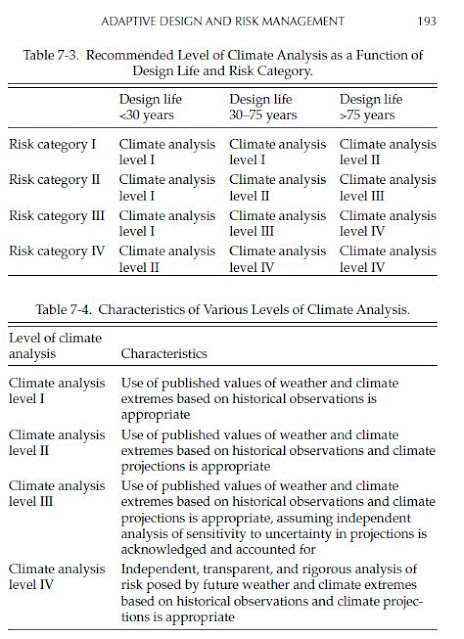
the investment when supported by the then available evidence. This approach bears a strong resemblance to
the Observational Method of the American Society of Civil Engineers (ASCE) in
relation to the adaptive design and risk management of infrastructure for
climate resiliency (ASCE, 2018). It is a
practical approach and is typically practiced in a less formal manner, although
there is merit in formalizing (and documenting) such assessment processes to
promote a comprehensive consideration of influencing matters as well as for
purposes of communications, both when the analyses are occurring periodically
over time, as well as across time periods.
The Canada in a Changing Climate:
National Issues report (Government of Canada, 2021) identifies Real Options
Analysis as one main approach for accommodating uncertainty in the economic
appraisal of adaptation actions.
CONCLUSIONS
The development of a national set of
guidelines to undertake comprehensive economic assessments of storm drainage and
flood control infrastructure is intended to promote, advance and to some extent
harmonize and standardize such practices across Canada and at various levels of
implementation. The guidelines,
supported by extensive foundational research, represent a comprehensive
reference for practitioners in assessing the value of initiatives that may be
considered, including the consideration of uncertainties (including those
related to potential climate change impacts), such that competing projects and
project alternatives can be objectively and rationally assessed so as to inform
decisions and promote the judicious allocation of investment capital. In many ways, these guidelines represent
somewhat of a renaissance of the application of classical engineering economics
in relation to matters that are of current relevance and in light of the vast
(and growing) amount of information and tools available to inform these
assessments.
BILBIOGRAPHY
American
Society of Civil Engineers (ASCE) (2018) Climate-Resilient Infrastructure:
Adaptive Design and Risk Management. Committee on Adaptation to a Changing
Climate.
Environment
and Climate Change Canada (ECCC) (2020) Climate-Resilient Buildings and Core
Public Infrastructure.
Government
of Canada (2021) Canada in a Changing Climate: National Issues.
National
Research Council of Canada (NRC) (2021) Guidelines on Undertaking a
Comprehensive Analysis of Benefits, Costs and Uncertainties of Storm Drainage
Infrastructure and Flood Control Infrastructure in a Changing Climate
Shephard, M.W., Mekis, E., Morris, R.J., Feng, Y., Zhang, X. (2014) Trends in Canadian Short-Duration Extreme Rainfall: Including an Intensity-Duration-Frequency Perspective, Atmosphere-Ocean, 52:5, pp. 398-417
***
The follow presentation was made at the conference in London, Ontario.