Showing posts with label urbanization. Show all posts

Town of Oakville Class Action Lawsuit Over Wider Floodplains and Flood Damages - Is Urbanization or Climate Change the Cause?

The CBC reported on a $1B class-action claim that alleges Oakville property owners are at flood risk due to 'over-development'.  The article appeared last week: https://www.cbc.ca/news/canada/toronto/1b-class-action-claim-alleges-oakville-property-owners-at-flood-risk-due-to-over-development-1.5755264

A resident interviewed for the story said that floodplain development restrictions have grown over time, restricting development activities on private property.

The mayor of Oakville explained the change in floodplains in the story: "He said that flood plains are continuously adjusted according to developing science and that the mapping in a century-old neighborhood like South Oakville would naturally require some changes over the years."

It is true that changes in analysis methods can affect floodplain extents.  Most likely the first high-level hydraulic models, using the USACE's HEC-2 program, were coded on punch cards in a consultant's office, and models were compiled and simulated on mainframe computers off-site (I know, I saw the old punch cards in our office storage in the early 1990's).  Personal computers came into offices in the 1980's to run the same simulations.

So floodplains have been estimated for many decades but not when centuries-old neighbourhoods in South Oakville were developed. 

Documentation from the US Army Corps of Engineers speaks to the computer requirements identified in the 1982 HEC-2 manual (image at right lists mainframe computers used on the top and emerging microcomputer PC's at the bottom).  The image below it represents bridge hydraulic model parameters in the USACE's Hydrologic Engineering Centre's HEC-2 hydraulic model - that input would be used to prepare punch cards in the early 1980's.  So forty years ago modelling was pretty basic right? And there was no such modelling 100 years ago.  

Hydrology models that determine flow rates in rivers have undergone similar upgrades over the decades just like HEC-2 hydraulic models.

So again, floodplains were not mapped 100-years ago in the 1920's in South Oakville.  Floodplain limits have not been changing on their own since then, unless the upstream land uses changed resulting in more flow or unless storms are bigger now.  According to Wikipedia, Conservation Halton, who has the role of mapping floodplains and regulating hazards (i.e., under O. Reg. 162/06: HALTON REGION CONSERVATION AUTHORITY: REGULATION OF DEVELOPMENT, INTERFERENCE WITH WETLANDS AND ALTERATIONS TO SHORELINES AND WATERCOURSES under Conservation Authorities Act, R.S.O. 1990, c. C.27), has been around (in one form or another) only since the 1950's according to their web site:

"Conservation Halton was formed in 1956 as the Sixteen Mile Conservation Authority followed by the formation of the Twelve Mile Conservation Authority in 1957. In 1963 these conservation authorities amalgamated to form the Halton Region Conservation Authority which later became known as Conservation Halton."

So floodplain mapping in South Oakville has likely not been in place for more than 40 to 50 years.  The 2014 report National Floodplain Mapping Assessment - Final Report prepared for Public Safety Canada charts the ago of floodplain mapping in Canada showing mapping started in the mid 1970's - see excerpt below:


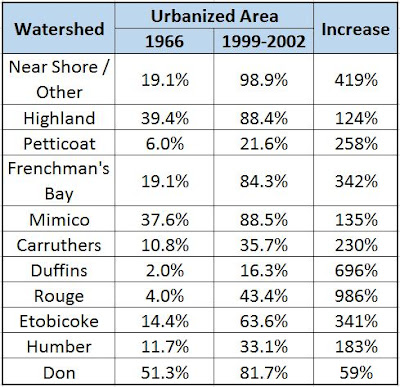
The CBC article discusses the causes of increased floodplain extents.  The key factor noted in the class action lawsuit is urbanization that can increase runoff volumes and runoff rates, thus increasing river flow rates and river flood levels.  High flood levels result in wider, more extensive floodplains.

Two reports by the Intact Centre on Climate Adaptation (TOO SMALL TO FAIL: Protecting Canadian Communities from Floods (2018), and Preventing Disaster Before It Strikes: Developing a Canadian Standard for New Flood-Resilient Residential Communities (2017)) lists other stormwater management and flood-related lawsuits in Canada.  So lawsuits related to flooding are not new.

So has there been development in Oakville and upstream of Oakville that could have increased flood risks?  First there has been development as shown in the following images.  The 1960 development limit is based on Statistics Canada dwelling age of construction in census dissemination areas (very approximate), the 1971, 1991, 2001, and 2011 development limits are from Statistics Canada as well.  The 2015 limits are according to Version 3 SOLRIS land use mapping from the Province of Ontario.


Its pretty clear that there has been development.  The urban area in Oakville in 1971 was about 3500 hectares.  In 2001 it was 8800 hectares.  In 2011 it was 9200 hectares. So that is a significant increase.

Secondly, has the development caused floodplain impacts?  Conservation Halton describes several flood mitigation measures that have been put in place decades ago to mitigate some earlier, long-standing flood risks.  These measures include (according to their web site):

Dams 

"Conservation Halton’s dams, along with many of the major dams within other conservation authorities across the GTA were built in direct response to the devastation associated with Hurricane Hazel (October 1954). Most of these facilities were constructed in the 1960’s and 1970’s, however none have been built since then as a more passive approach to hazard management, including land acquisition and regulation, were adopted instead of costly engineered structures."

  • Scotch Block Reservoir
  • Hilton Falls
  • Kelso
  • Mountsberg
Flood Control Channels

"Conservation Halton built three flood channels between the late 1960’s and 1970’s to safely move water through our communities and into Lake Ontario as quickly as possible. The three channels are Hager-Rambo in Burlington, Milton and Morrison-Wedgewood in Oakville. The channels are designed to move large flood flows which may result from rapid rainfall or a longer rain event away from historically developed flood sensitive / prone areas."

So works are in place to address earlier-noted flood risks, say up to the 1960's and 1970's.  More recent development has been supported by robust planning and risk mitigation measures, including effective stormwater management.  There is a risk that development that has occurred between the 1970's and the early 2000's could have increased flood risks - after that time more robust mitigation are generally in place to account for cumulative watershed effects, e.g., due to higher runoff volume.  Intensification within existing development areas can also increase runoff and contribute to higher flood risks.

The CBC story discusses the role of different factors saying "At its core, the claim blames increased flood risk in South Oakville on urban development. But there are other factors that can affect an area's risk for flooding, and the most important of those may be climate change."

Is climate change the most important factor? Have observed rainfall volumes increased during storms or have design intensities for rare, extreme rainfall events increased?

To answer those questions one can review the published Engineering Climate Datasets from Environment Canada to evaluate how annual maximum rainfall amounts and design intensities have changed over the years.  The data on observed maximum annual rainfall, measured over various durations of 5 minutes to 24 hours, show no increase at long-term climate stations surrounding Oakville.  The Pearson Airport climate station to the east of Oakville shows no increases in observed annual maxima going back to the 1950's (see Environment Canada chart below).


When observed rainfall extremes decrease as noted above, so do the derived design rainfall intensities.  The next table shows how design rainfall intensities over a 5-minutes duration have decreased since 1990.


There are decreases for 2-year intensities, for which there are a lot of observations, and decreases for rare 100-year intensities too (note: the intensities inched up temporarily after the July 8, 2013 storm but have trended back down now).

The Town of Oakville actually uses the downtown Toronto rainfall gauge for their design guidelines.  A recent study for the Town confirmed that the Toronto gauge data can be used to design in the future as well.  Town consultant Wood assessed future rainfall and Town’s existing design intensities (Review of Future Rainfall Scenarios, December 2018), and asked and answered this question:

"1. Should the Town of Oakville maintain its rainfall standard based on the Toronto City Environment
and Climate Change Canada station or move to a database within the boundaries of the Town?

Recommendation: Maintain the Toronto City ECCC station as the basis for the Town’s design IDF
relationship."

The IDF relationship is the Intensity-Duration-Frequency characteristics used to design drainage systems).  The Town's consultant recommended using the Environment Canada data that is showing decreasing annual maximum rainfall. 

Specifically what is happening at the Toronto station used for Oakville drainage design? Annual maximum measured rainfall is generally declining for all durations - the 12-hour duration rainfall even has a statistically significant decrease (bottom middle chart below).


These observed decreases result in engineering design intensities that decrease as well. Over a 5 minute duration, these design intensities have been decreasing since the 1990 IDF updates for the Toronto rainfall gauge.  The rare 50 and 100 year rainfall intensities are decreasing the most a shown in the table below.


To the west of Oakville, in Hamilton, the annual maximum rainfall observations at the Royal Botanical Gardens show decreases or no change in rainfall since the 1960's:


The Hamilton Airport observed trends are also lower for short durations (see chart below). Trends for long durations are flat since the early 1970's.


Looking wider beyond those four stations above, a review of Southern Ontario trends shows in a previous post shows the trends at 21 long-term climate stations: https://www.cityfloodmap.com/2020/05/southern-ontario-extreme-rainfall.html. This is a summary figure and table that show decreases in frequent storm intensities and virtually no change in extreme infrequent storm intensities:

Southern Ontario IDF Rainfall Intensity Trend Chart by Duration - Environment and Climate Change Canada's Engineering Climate Datasets, Pre-Version 1.00 (up to 1990) to Version 3.10 (up to  2017)
 

So.

Development has increased significantly since the 1960's, and has doubled since mitigation works were constructed in the early 1970's to 2001 after which stormwater management measures have become more robust.  So development seems to be an important factor.


Rainfall extremes have not changed since the 1950's and 1960's at surrounding climate stations, or in southern Ontario in general. So rain does not appear to be a factor resulting in higher and wider floodplains - while Milli Vanilli can Blame it on the Rain (see below), CBC could do some fundamental fact checking on the topics in the story.


The CBC story suggests "it's difficult in general to "decouple" the effects that climate change and urbanization have on flood risk" and "determining that one played more of a role than the other is challenging" - perhaps in general it is difficult, and perhaps it is challenging.  But the difficult work has been done in this case already.  Statistics Canada has mapped urbanization growth in Oakville, and Environment and Climate Change Canada has charted and analyzed extreme rainfall trends in the region as well.   

Given the specific data here, CBC does not appear to offer any support for this statement "At its core, the claim blames increased flood risk in South Oakville on urban development. But there are other factors that can affect an area's risk for flooding, and the most important of those may be climate change."

***

Here is a higher resolution video showing the land use progression in Oakville (you can enlarge it once it starts to play):


Do Baseflow Impacts of Urbanization Warrant Green Infrastructure Retrofits to Restore Water Balance?

Green infrastructure, low impact development practices (LIDs), also called stormwater management best management practices (SWM BMPs), are often proposed to restore water balance functions and mitigate impacts or urbanization on runoff and recharge. One argument is that baseflows are lowered due to reduced infiltration and discharges to watercourses. It is a simple textbook theory.

What does the data show on baseflow impacts? The following slide presentation was prepared to respond to the Ontario draft LID guidance manual in early 2017 since water balance impacts have been cited as justification for green infrastructure LIDs.


Local studies show that baseflows have increased over decades of urbanization, calling into question the need for such measures considering that potential impact has not materialized. As noted in TRCA's Approved Updated Assessment Report under the Clean Water Act, at most gauges there was an upward trend in baseflows which prompted this statement: "These overall increases to baseflow volumes are contrary to the common thought that increased impervious cover leads to reduced baseflow" - so for those keeping score, data - one, common thought - zero. (see page 3-40 at link to full report - disregard old link in the slide deck thx!).

TMIG also analyzed baseflows in the GTA and noted “The seven-day average consecutive low flow data provides an indication of the observed baseflows within a watercourse, and hence is a suitable measure for determining whether baseflow trends exist in an urbanizing area. The trend analysis identified noticeable baseflow trends in 13 of the 24 recording stations. Of these eight urban and two rural stations exhibited an upward trend, suggesting increasing baseflow.” (link to full report).

It would appear that baseflow stresses due to urbanization, i.e., development within the GTA, do not support the need for green infrastructure implementation to restore water balance functions.

Lost Rivers and Urban Flooding - Review of Flood Risk Factors in Toronto Wards 13 / 14 - Decreasing Extreme Rainfall Trends, Increasing Urbanization and Intensification. Financially unsustainable green infrastructure.

Toronto Wards 13 / 14 Lost Rivers Overland Flow Paths
(image can be downloaded using link at bottom of post)
The following presentation to Toronto's Green 13 group explored the role of 'lost rivers' like Ward 13/14 Wendigo Creek and Spring Creek, in driving urban flood risk. Urbanization and intensification are revealed as key factors affecting runoff rates and flood risk. Extreme rainfall trends are shown to be decreasing in Toronto and other long term Ontario climate stations, indicating no impacts due to climate change. Variations in runoff rates are shown to be explained by changes in urbanization that increase runoff coefficients in the Don River since the mid sixties, as urbanization and intensification have increased. Insurance industry claims of more frequent severe weather are shown to be disproved by Environment and Climate Change Canada's Engineering Climate Datasets.


Lost Rivers & Urban Flooding, Media, Myths & Smart Mitigation - Toronto Wards 13 / 14 - Presentation to Green 13 from Robert Muir

Toronto lost rivers (aka overland flow paths) can be explored on the following interactive map - map is (c) CityFloodMap.Com. Note, approximate TRCA regulation boundaries were estimated from camaps.ca georeferenced image features, and TRCA shoreline/slope regulation areas and some natural heritage regulation areas have been excluded to focus more on where river flood risks exist:

View larger map


The Green 13 meeting handout illustrating Toronto Ward 13 / 14 lost rivers and overland flow paths is available at the following link:  handout file

University of Guelph Research Shows Lower Spring Flooding With Global Warming, No Change in Rainfall, and Explains Urban Flooding Due to Urbanization - Not Climate Change Effects

Research from the University of Guelph has shown that climate change has reduced spring flooding risk (exponential growth in frost-free days with more recharge and less snow pack / spring melt) and that summer flow changes are due to urbanization, not changes in precipitation.

The presentation below summarizes the research and is entitled "Disentangling Impacts of Climate & Land Use Change on Quantity & Quality of River Flows in Southern Ontario" - the authors, Trevor Dickinson and Ramesh Rudra from the University of Guelph clearly see the need to clarify drivers for flow changes and to avoid the common media mistake of associating all extreme hydrologic conditions with climate change and omitting changes that may lower risks (like spring flooding in some watersheds).


Research indicates:
1) Monthly and Annual Precipitation has remained unchanged (see slide 7)
2) Temperatures have risen 'mostly in the winter' (see slide 13 - 14), meaning summer maximum temperatures that are typically associated with extreme rainfall have not increased, or have decreased
3) Extreme daily maximum temperatures have decreased (slide 14)
4) Increased winter temperatures mean more steady winter runoff, more infiltration and "Decreased Snowmelt Floods" (see slides 24 - 31)
5) Urbanization increases runoff coefficients (slide 36-37) and:

" So … in Ontario urban watersheds: - urban development has augmented the winter and spring climate change impacts; and - summer flow volumes have increased dramatically, in volume and frequency, these impacts being completely due to urban development."

The big take away is that urbanization is a key driver for summer river flows in Southern Ontario, but climate change is not - this is supported by trends in the Engineering Climate Datasets (version 2.3) that show twice as many statistically significant decreasing Southern Ontario trends as increasing ones.

This analysis is consistent with review by others showing change in minimum temperatures but no change in summer maximum temperatures. For example, the Ontario Centre for Climate Impacts and Adaptation Resources reviewed climate change trends for several stations - for Ottawa airport, between 1939 and 2014, the average winter minimum is up by 2.5 degrees Celcius and average winter mean is up 2.2 degrees. But the summer maximum is flat - no change. While the summer mean temperature is up by 0.5 degrees, this is due to increases in minimum temperatures, which were up by 1.1 degrees. These graphs from the Centre show the difference in winter temperatures changes and summer temperatures changes:

Winter temperatures have increased with climate change - Ottawa, 1939-2016

Summer maximum temperatures (middle chart) have NOT increased with climate change - Ottawa, 1939-2016. Changes in mean temperature are driven by changes in minimum temperatures.
Those who point to the Clausius-Clapeyron equation and a greater water vapour holding capacity at higher temperatures as a driver for climate change-induced flooding in urban areas should reevaluate their position, and consider the data on maximum temperatures. Since there is no increase in summer maximum temperature at some stations, the cause of flooding due to extreme rainfall cannot be greater water vapour holding capacity of the air - as research at the University of Guelph has shown, urbanization and not climate change is the key driver for changes in river flow. We can expect the same types of flow impacts beyond river systems and within municipal infrastructure systems, where urbanization and intensification have increases hydrologic stresses on systems even with no change to rainfall inputs.

The Ontario Centre for Climate Impacts and Adaptation Resources reviewed climate change trends for Hamilton as well. The following charts show the same relative temperatures changes as Ottawa:
Hamilton winter temperature has increased the most due to climate change.

Hamilton summer temperatures have increased at only a fraction of the winter increase.
 The Hamilton summer maximum temperatures increase (0.4 degrees in 40 years from 1970 to 2010) is only a fraction of the winter maximum increase (1.8 degrees in 40 years). The 0.4 degree increase in summer maximum would translate into less than a 3% change in water vapour holding capacity over 40 years. A review of research in another post has shown that temperature increases have not resulted in extreme rainfall increases across Canada - see post here.

Urbanization has increased significantly in Southern Ontario since the mid 1960's as shown in this post - this includes Hamilton growth:


In the Toronto area, where the University of Guelph assessed changes in runoff and linked these to urbanization as opposed to climate change, growth has also been significant since the mid 1960's. The following table shows changes in Toronto-area watersheds where urbanization increased from 59% to 986% over a perido of about 35 years. Compared to theoretical temperature-induced water vapour changes changes of a few percentage, if any at all, urbanization clearly explains higher runoff stress and flood risk while climate change explains none of the risks.

Urban Growth in TRCA watersheds and Flood Risk Influence on Urban Flooding

Greater Toronto Area Urban Area Growth in TRCA watersheds and Flood Risk Influence on Urban Flooding

Urbanization, Runoff, Overland Flow and Flooding - How Sprawl of Ontario Cities Drives Flood Risk and Insurance Losses in Urban Areas

Readers of this blog have seen these basic process described several times: (1) rain transforms into runoff when it hits the ground, (2) runoff accumulates and flows in rivers or municipal drainage infrastructure, (3) the capacity of the flow systems determines whether flow "backs up", "surcharges", "spills", or generally flows uncontrollably to where we don't want it to go, causing flooding.

Using Environment Canada's data and research, we have shown that rainfall intensities have not increased in southern Ontario here. In fact there are more statistically significant rain intensity decreases than increased south of 44 degrees. So the rainfall influence on runoff is not increasing. But runoff has been increasing after decades of urbanization under the today's stable or decreasing rainfall intensities.

The following maps show urban expansion in Mississauga, Oakville and Burlington Ontario from 1966 to about 2000 (data varies from 1999 to 2002). The overland flow system path based on Ontario conditioned digital elevation model is superimposed on the land use map so that the impact of urbanization and runoff into the drainage system can be considered.


 The effect of urbanization in Mississauga on runoff would be most acute in the smaller watersheds (e.g., not the Credit), where the upstream urban area has increased significantly since 1966.


Likewise in Oakville - Bronte Creek, a large watershed more slightly influenced by the city's sprawl, has not been affected to the same degree as the smaller Fourteen Mile Creek to the west, where a high relative change in land use over that smaller watershed has occurred throughout the city.


Same in Burlington - many small creek watersheds originating off the escarpment have dramatically increased urbanization over three decades. Burlington is characterized by creeks that have been realigned, straightened and encroached upon. These can be expected to be more sensitive to increased runoff rates due to expanded urbanization.

***

Parts of Hamilton have been urbanized up to the watershed divide (black line) by the late 1990's / early 2000's. How does this affect runoff into the old 'core' built to pre-1960's standards?


Hamilton, wider perspective. Some wetlands remaining upstream of Dundas? :


Richmond Hill (Lake Wilcox near upper middle of map). Some urbanization around the lake flows to the Humber where flow impacts would be muted, while other areas to the south flow flow to headwater tributaries of the Don and Rouge:


Land Use Change Drives Urban Flood Risk .. Yet Hydrologists Become "Useless Appendage" To More Virile Sciences

"The unsatisfactory state of hydrology is, in the final analysis, the result of the dichotomy between the theoretical recognition of hydrology as a science in its own right and the practical impossibility of studying it as a primary discipline but only as an appendage of hydraulic engineering, geography, geology, etc." Vit Klemeš in Dilettantism in hydrology: Transition or destiny?, Water Resources Research, Vol. 22, 1986.

That explains it! Nobody studies hydrology in its own right, and so this limp appendage of other scientific pursuits has been ignored. Pity - because hydrologic science and simple quantifiable land use changes can explain increased runoff and increased urban flood damages in Ontario municipalities. Why is it ignored? Because hydrology is just the run up to other things like dynamic hydraulic simulations and then infrastructure construction.

Take a look at these Ontario urban area land use maps, and see how the limits of urban areas have increased over thirty years or so from 1966 to the late 1990's. It can be dramatic. For some catchments, the increase in urban land coverage can be an order of magnitude.


Sure, some of these areas developed between 1966 and 2000 have stormwater management controls up to a point. But it is commonly accepted that the on-site local stormwater controls do not completely address cumulative volumetric runoff impacts at larger scales. And the controls are finite - not controlling the rarest storms that drainage infrastructure could see in its design life. So expanded urban areas can drive downstream flood risk. Yes, every catchment is different and maybe no property is at risk downstream of some urbanized area (i.e., dedicated drainage easements and wide regulated flood plains have maintained a wide major flow path) - but in may cities the overland flow path has not been mapped managed or preserved, so increased runoff and flood risk can result.
Tantric Hydrology
Brought to you by the Flood Guru.
OK, could a movie about hydrology be any worse than The Love Guru? I guess.....