Showing posts with label global warming. Show all posts

University of Guelph Research Shows Lower Spring Flooding With Global Warming, No Change in Rainfall, and Explains Urban Flooding Due to Urbanization - Not Climate Change Effects

Research from the University of Guelph has shown that climate change has reduced spring flooding risk (exponential growth in frost-free days with more recharge and less snow pack / spring melt) and that summer flow changes are due to urbanization, not changes in precipitation.

The presentation below summarizes the research and is entitled "Disentangling Impacts of Climate & Land Use Change on Quantity & Quality of River Flows in Southern Ontario" - the authors, Trevor Dickinson and Ramesh Rudra from the University of Guelph clearly see the need to clarify drivers for flow changes and to avoid the common media mistake of associating all extreme hydrologic conditions with climate change and omitting changes that may lower risks (like spring flooding in some watersheds).


Research indicates:
1) Monthly and Annual Precipitation has remained unchanged (see slide 7)
2) Temperatures have risen 'mostly in the winter' (see slide 13 - 14), meaning summer maximum temperatures that are typically associated with extreme rainfall have not increased, or have decreased
3) Extreme daily maximum temperatures have decreased (slide 14)
4) Increased winter temperatures mean more steady winter runoff, more infiltration and "Decreased Snowmelt Floods" (see slides 24 - 31)
5) Urbanization increases runoff coefficients (slide 36-37) and:

" So … in Ontario urban watersheds: - urban development has augmented the winter and spring climate change impacts; and - summer flow volumes have increased dramatically, in volume and frequency, these impacts being completely due to urban development."

The big take away is that urbanization is a key driver for summer river flows in Southern Ontario, but climate change is not - this is supported by trends in the Engineering Climate Datasets (version 2.3) that show twice as many statistically significant decreasing Southern Ontario trends as increasing ones.

This analysis is consistent with review by others showing change in minimum temperatures but no change in summer maximum temperatures. For example, the Ontario Centre for Climate Impacts and Adaptation Resources reviewed climate change trends for several stations - for Ottawa airport, between 1939 and 2014, the average winter minimum is up by 2.5 degrees Celcius and average winter mean is up 2.2 degrees. But the summer maximum is flat - no change. While the summer mean temperature is up by 0.5 degrees, this is due to increases in minimum temperatures, which were up by 1.1 degrees. These graphs from the Centre show the difference in winter temperatures changes and summer temperatures changes:

Winter temperatures have increased with climate change - Ottawa, 1939-2016

Summer maximum temperatures (middle chart) have NOT increased with climate change - Ottawa, 1939-2016. Changes in mean temperature are driven by changes in minimum temperatures.
Those who point to the Clausius-Clapeyron equation and a greater water vapour holding capacity at higher temperatures as a driver for climate change-induced flooding in urban areas should reevaluate their position, and consider the data on maximum temperatures. Since there is no increase in summer maximum temperature at some stations, the cause of flooding due to extreme rainfall cannot be greater water vapour holding capacity of the air - as research at the University of Guelph has shown, urbanization and not climate change is the key driver for changes in river flow. We can expect the same types of flow impacts beyond river systems and within municipal infrastructure systems, where urbanization and intensification have increases hydrologic stresses on systems even with no change to rainfall inputs.

The Ontario Centre for Climate Impacts and Adaptation Resources reviewed climate change trends for Hamilton as well. The following charts show the same relative temperatures changes as Ottawa:
Hamilton winter temperature has increased the most due to climate change.

Hamilton summer temperatures have increased at only a fraction of the winter increase.
 The Hamilton summer maximum temperatures increase (0.4 degrees in 40 years from 1970 to 2010) is only a fraction of the winter maximum increase (1.8 degrees in 40 years). The 0.4 degree increase in summer maximum would translate into less than a 3% change in water vapour holding capacity over 40 years. A review of research in another post has shown that temperature increases have not resulted in extreme rainfall increases across Canada - see post here.

Urbanization has increased significantly in Southern Ontario since the mid 1960's as shown in this post - this includes Hamilton growth:


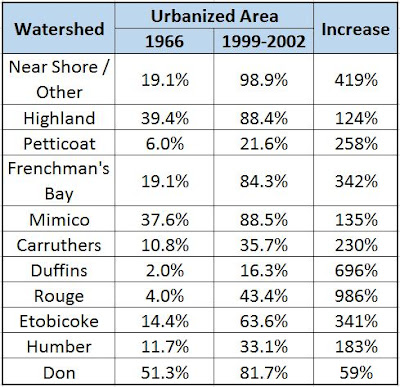
In the Toronto area, where the University of Guelph assessed changes in runoff and linked these to urbanization as opposed to climate change, growth has also been significant since the mid 1960's. The following table shows changes in Toronto-area watersheds where urbanization increased from 59% to 986% over a perido of about 35 years. Compared to theoretical temperature-induced water vapour changes changes of a few percentage, if any at all, urbanization clearly explains higher runoff stress and flood risk while climate change explains none of the risks.

Urban Growth in TRCA watersheds and Flood Risk Influence on Urban Flooding

Greater Toronto Area Urban Area Growth in TRCA watersheds and Flood Risk Influence on Urban Flooding

The Inconvenient Truth - Rainfall in Canada Not More Extreme with Global Warming

Unless you only look at meteorology, and forget
hydrology, and ignore hydraulics, in which case you
may prove that you are dumb too.
It's not just inconvenient its down-right annoying! Because Environment Canada data shows storms are not getting worse, we have to really think, think hard about why flood damages have been increasing in Canada. Scientists are muzzled from speaking about their research it seems.

"People are not accustomed to thinking hard, and are often content to trust a plausible judgment that comes to mind."
Daniel Kahneman, American Economic Review 93 (5) December 2003, p. 1450

Well we'll show you some hard thinking Mr. Kahneman, you and your fancy Nobel Prize! Here goes:

OK. First let's explain Alberta 2013 flooding. Easy peasey lemon squeezey: they built stuff in the river flood plain, right in the floodway, and they built more and more and then the expected design floods arrived, in line with expected statistical probabilities, and so Calgary flooded. And High River flooded too. No surprise there. Done. QED. Next?

Let's use the scientific method to explain Toronto 2013 urban flooding outside of river flood plains. Why outside the flood plain? Because that is where over 95% of the flood damages occurred in 2013, 2005 and 2000 floods.

Canadian Insurance Company Ad
Hypothesis #1 - Storms are becoming more severe or occurring more often. That would be so easy to explain all the flooding, right? And the insurance industry said it was true, just like the advertisement for flood insurance to the right.

Experiment #1 - The insurance industry statement that weather events (and thunderstorms and extreme rain) that occurred every 40 years are now happening every six years has been thoroughly discredited as an inaccurate mistake based on theoretical speculation and no data. Some insurance companies have recently updated their advertisements to remove the statement. Environment Canada has advised the CBC on reporting inaccurate insurance industry statements that claimed more storms are happening now - CBC corrected their report.

But don't take CBC's word for it - "Trust No One" as Mulder would say - do your own research. That's what CityFloodMap.Com did over the holiday break. We created a host of resources for you to explore extreme weather trends across Canada including interactive maps, summary tables, bar charts, pie charts ... whew!

This is a link to a post with all the resources. Spoiler alert. Only a few percentage of Canadian climate stations show any 'non-random' increase in recorded extreme rainfall intensity or frequency, despite the fact that temperatures have clearly increased.

You may want to believe that storms have become more severe because:
  1. You have demonstrated heuristic biases in your reasoning around extreme rainfall and flooding, particularly Kahneman's defined anchoring bias, availability bias, and substitution bias.
  2. You operate a commuter rail line in Toronto and inflating the severity of extreme rainfall events would divert attention from unsafe operational practices, like sending a GO Train into a high risk flood zone that flooded even worse weeks before.
  3. It supports your ideological pursuit against greenhouse gas emissions if, like Milli Vanilli, you can Blame it on the Rain.
But back to Toronto flooding. We looked at the best rainfall records, screening out the less reliable short-duration monitoring periods and out-of-service climate stations. Here is what we have for rainfall trends in Ontario:

climate change Ontario
Ontario climate change trends in observed extreme storm intensity.
Southern Ontario has a lot of decreasing extreme rainfall trends, some are statistically significant, or strong, trends, including in Toronto and Windsor.  Ottawa Airport with 39 years of record had significant decreasing trends for short durations as well, but did not make the cut off.

Conclusion #1 - Are storms becoming more severe? Is that the cause of increased flooding? No. Environment Canada's official data does not support that hypothesis.

***

Hypothesis #2 - Toronto flooding is not explained by meteorology, but rather hydrology and increased runoff, and hydraulics and constrained flow capacity.

Experiment #2 - Back to 'thinking hard', or as Kahneman said in his book, 'thinking slow'.

First let's recognize that between rain and flooding there are several processes, runoff and flow. Many factors affect runoff volume and rate and more affect flow (i.e., the complex hydraulic capacity of sewer infrastructure and the overland flow system (lost rivers). The only Toronto homes that flooded directed due to rain did not have a roof. Homes flood when flow rates, driven by runoff, exceed the hydraulic capacity of conveyance systems, causing them to "back-up" and cause flooding.

We have proposed several causes of flooding to the Minister of the Environment and Climate Change in a letter this summer based on these processes. These included observations about hydrology and increased runoff, and the hydraulics of wastewater collection systems including documented flood impacts in the Municipal Class Environmental Assessment study in my neighbourhood, and observations about overland flood hazard regulation, including correlation with observed basement flood density. Getting a response was slow - we just received a thank you email that did not address the questions on extreme rain trends, and instead doubled down on the emissions strategy as the means to address flooding.

Conclusion #2 - The Truth is "Out There". So is the Ontario government. It does not want to consider the inconvenient truth that extreme rainfall is not increasing in Ontario, and so it has misdirected policy solutions to flooding.  We've always said there are good reasons to be concerned about global warming. But mitigating flood risks is not one of them, despite predictions of more extreme rainfall - as Yogi Berra said "It's tough to make predictions, especially about the future."

Even if storms become worse in the future, the fact that flood damages have already increased in Canada but extreme weather has not, means there are some hard questions to answer on real causes. Some are technically hard, like simulating and calibrating hydrologic and hydraulic models to determine infrastructure constraints and upgrades. Cities are doing that. Some are politically hard, like regulating overland flow systems (lost rivers) in developed communities. Some are administratively hard, like expanding the Ministry of Natural Resources and Forestry and Conservation Authority mandates beyond valley natural hazards, and combining with Ministry of Municipal Affairs or Intrastructure ministry interests. These last two are in the hands of the Ontario government.  But unfortunately Kahneman is right, as people are not accustomed to thinking hard, increasing rainfall is a plausible judgment.