Showing posts with label annual maximum rainfall. Show all posts

NRC National Guidelines on Flood Control Cost-Benefit Analysis Indicate 100-Year Storm Intensities Not Increasing

The National Research Council of Canada (NRC) has released the National Guidelines on Undertaking a Comprehensive Analysis of Benefits, Costs and Uncertainties of Storm Drainage and Flood Control Infrastructure in a Changing Climate.

The full guidelines are available here to download: https://nrc-publications.canada.ca/eng/view/object/?id=27058e87-e928-4151-8946-b9e08b44d8f7

These guidelines delve into many topics to support comprehensive benefit cost analysis. As the effects of a changing climate on flood damages (and adaptation benefits of reducing them) are considered, trends in extreme rainfall across Canada are reviewed in the foundation research. The review shows that on average extreme rainfall intensities have not increased when the most recently observed data is considered.

Extreme rainfall intensities can be characterized by the high return period values in Intensity-Duration-Frequency (IDF) statistics. For example the 100-year rainfall intensity would be the rate of rainfall over a range of durations that has a 1% chance (i.e., 1/100) of occurring in a single year, based on the statistical analysis of past observations.   Similarly 50-year storm rainfall rates have a 2% change of occurring during any year (i.e., 1/50), 25-year rainfall has a 4% chance, 10-year has a 10% chance, etc..

The guidelines present the following table showing 2-year to 100-year design rainfall intensity trends at 226 climate stations across Canada for durations of 5 minutes to 24 hours (Appendix E, Table 17):


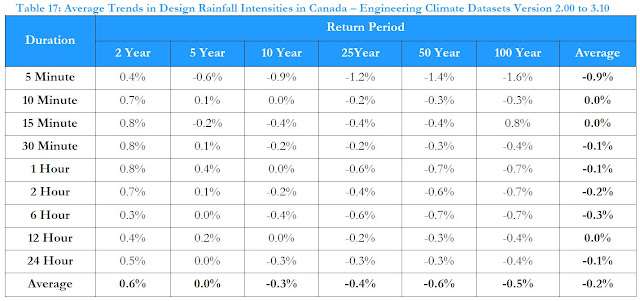
As shown, 100-year storm intensities have decreased on average by 0.5% from the v2.00 to the v3.10 Engineering Climate Datasets. On average the derived 10-year to 50-year rainfall rates have decreased as well.

IDF intensity values are derived from observed annual maximum rainfall values, called an annual maximum series (AMS). One can look at the trends in AMS values to understand how derived 'return period' intensities are changing over time. The NRC guidelines summarized Environment and Climate Change Canada's analysis of these trends across Canada in the following table (Appendix E, Table 11):


The table counts instances where observed rainfall has decreased significantly (i.e., a statistically strong trend), has decreased (a weaker trend), has not changed, has increased (a weak trend), or has increased significantly (a strong trend).  Across Canada the totals show decreasing trends in 131+2235=2366 data points and increasing trends in 2526+251=2777 data points. And 266 data points showed no change. This summary indicates that both decreases and increases are occurring, with slightly more increases.

The NRC guidelines present additional analysis of more regional trends as well. This can help practitioners understand recent changes in extreme rainfall affecting local flood damages. For example the AMS trends in southern and northern Ontario are presented in the following two tables (Appendix E, Annex E1, Table A Part 3 & Part 4):

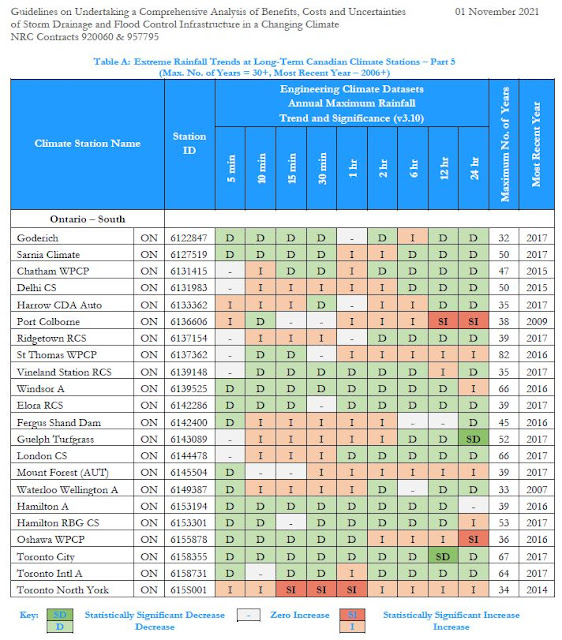
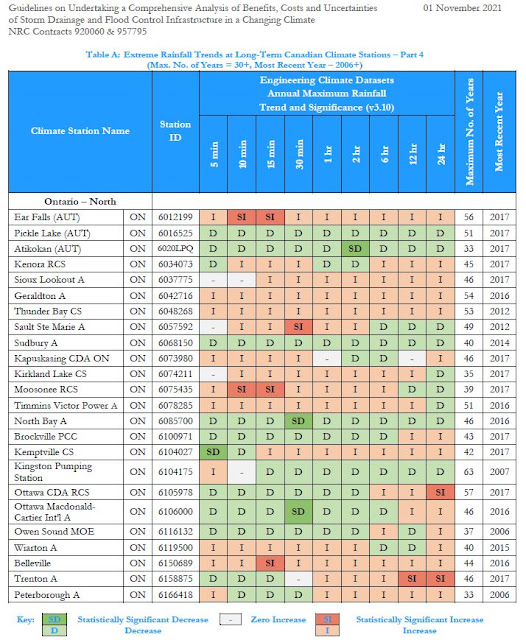
Ontario is shown to have increasing and decreasing AMS values (i.e., annual maximum observed rainfall) that varies by location (climate station) and duration. In some cases annual maximum rainfall is decreasing/unchanged or increasing/unchanged for all durations while in others short duration values have increased while long duration values have decreased - or vise versa. For example:  

Stations with all decreasing/unchanged trends for all durations:

  • Elora RCS
  • Hamilton A
  • Toronto City
Stations with all increasing/unchanged trends for all durations:
  • Toronto North York
  • Sioux Lookouk
  • Geralton A
  • Thunderbay CS
  • Belleville
Overall there are more decreasing AMS trends in southern Ontario (top table) than in northern Ontario. (Note the divide for southern and northern climate stations was taken as latitude of 44 degrees so Brockville, Kingston, Kemptville and Ottawa stations are in the northern group.)

The changes in IDF design intensity values for southern Ontario follow the regional trends in AMS values. This is what is expected since IDF statistics are derived from the observed AMS data. While Table 17 above showed changes in IDF values between the v2.00 and 3.10 datasets, essentially the difference resulting from accounting for the last 10 years of observations, southern Ontario IDF changes over a longer period were assessed in the NRC guidelines. The following figure shows the range in design intensities at long term stations since 1990 (Appendix E, Figure 2): 


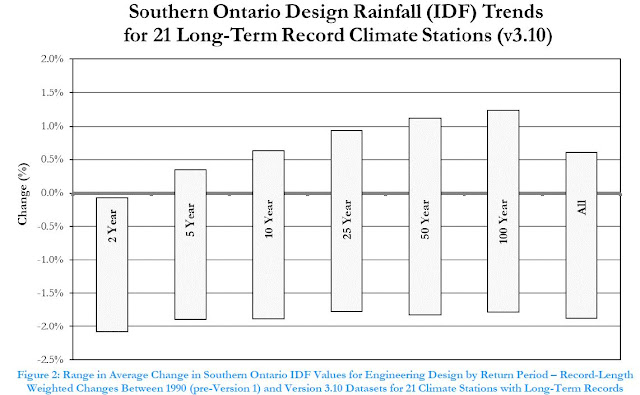
Overall 2-year rainfall intensities, representing smaller storm severity, have decreased. Meanhile 100-year intensities have increased and decreased. This analysis aggregates all durations. Given the variability from station to station shown earlier (e.g., Toronto City has decreasing trends while Toronto North York has increasing trends, trends in long and short durations are inconsistent at individual stations), there is a benefit in aggregating larger sets of data (across durations and geography) to estimate overall regional trends.

(Aside - the analysis of southern Ontario IDF trends in the NRC guideline presented above were recently updated to reflect the v3.20 datasets and average trends for durations within each return period were analyzed as well. Results are presented in this post: https://www.cityfloodmap.com/2021/10/rainfall-design-intensities-in-southern.html


The figure above shows more consistent decreases across durations for the small storm intensities (i.e., 2 to 5-year return periods.)


Annual Maximum Rainfall Trends in Canada - Environment Canada Engineering Climate Datasets v3.10 Update

A recent post (https://www.cityfloodmap.com/2020/02/annual-maximum-rainfall-trends-in.html) reviewed trends in annual maximum rainfall, their direction and statistical significance (i.e., showing whether the trends strong or are mild and just reflect normal variations).

Now there is an update. Environment and Climate Change Canada has just released v3.10 of the Engineering Climate Datasets that include annual maximum series data used to derive IDF curves, as well as the trends in those annual maximum series.  (note: trend data are contained in the comma delimited text file idf_v-3.10_2020_03_27_trends.txt in the IDF_Additional_Additionnel_v3.10.zip file on the Environment Canada download site).

Overall many additional stations have been added to the trend analysis.  Version 2.30 had 565 stations, Version 3.00 had 596 station and Version 3.10 now has 651 station.  The average length of record is 25.5 years.  How have the trends in annual maximum rainfall changed? The 3 charts below show that the change is very gradual, there are more significant increases than decreases, but overall the percentage of non-significant trends is unchanged.

Annual Maximum Rainfall Trends in Canada Environment Canada Engineering Climate Datsets
Maximum Rainfall Trends in Canada - Engineering Climate Datasets v3.10, v3.00 and v2.30, Environment and Climate Change Canada
The summaries at the bottom show:

Trend in Maximum Rain   v3.10        v3.00         v2.30
Significant Increase            4.28%      4.18%        4.09%
Significant Decrease           2.24%      2.33%        2.30%
No Significant Trend        85.80%     85.55%      86.37%
No Calculation                    7.68%      7.94%        7.24%

How about regional trends? Some provinces have more decreases than increases:

annual maximum rainfall environment canada data trends
Annual Maximum Rainfall Trends in Canada, by Province / Region - Environment and Climate Change Canada Engineering Climate Datasets v3.10 (March 2020)


Trends in the Toronto area are shown on the following charts for the City of Toronto, City of Mississauga (Pearson Airport), and City of Markham (Buttonville Airport).

City of Toronto Annual Maximum Rainfall Environment Canada
Toronto Maximum Rainfall
City of Mississauga Annual Maximum Rainfall Environment Canada
Mississauga Maximum Rainfall

Markham York Region Maximum Rainfall Annual Maximum Rainfall
Markham, York Region Maximum Rainfall

Trends in Toronto indicate annual maximum rainfall is decreasing for all durations from 5 minutes to 24 hours.  The decrease for the 12 hour duration is statistically significant.

Trends in Mississauga at Pearson Airport are decreasing for most durations, however the 1 hour duration trend is increasing due to the July 8, 2013 peak.  No Mississauga trends are significant.

Trends in Markham, in southern York Region are decreasing for shorter durations of 30 minutes or less and increasing for longer durations. None of the trends are significant.