Showing posts with label design standards. Show all posts

Practical Climate Change Resilience for the Stormwater Management and Wastewater Engineering Professional

Accounting for future climate change impacts is recommended in Ontario policies and regulations. A review of these drivers was described in a recent presentation as follows:


How are stormwater management and wastewater engineering professionals accounting for these impacts practically to meet the requirements of the Provincial Policy Statement, the Infrastructure Jobs and Prosperity Act, Environmental Assessment requirements and Planning Act amendments in Bill 139?  They are taking a couple of simple approaches: i) adjusting intensity-duration-frequency (IDF) curves to account for potentially higher future rainfall intensities, or stress testing systems with such higher intensities, or ii) stress testing systems with conservative hyetographs, i.e., rainfall patterns, in hydrologic and hydraulic simulation models.

Some examples are as follows:

1) City of Markham, Ontario - Wastewater Collection System

Markham evaluated the resilience of its wastewater collection system considering historical storms with a climate change adjustment (adding 30% to rainfall intensities) and its Chicago storm.  The Chicago storm hyetograph was determined to me more conservative than the adjusted historical storms and was deemed to account for future climate change effects as well as other uncertainties.  Results were presented at the WEAO 2018 annual conference.

2) City of Markham, Ontario - Stormwater System

Markham evaluated the resilience of a flood-prone stormwater collection system considering local IDF data, and its 3-hour AES design hyetograph. The 3-hour AES design storm intensities were above local IDF intensities, and the local and regional trends in intensities were found to be decreasing. The use of the 3-hour AES hyetograph was determined to be sufficient to account for future climate change impacts, as discussed in the 2019 Don Mills Channel Class EA study report.

3) Windsor/Essex Region, Ontario Stormwater Systems

Stantec developed the Windsor/Essex Region Stormwater Management Standards Manual in 2018. The manual includes a review of IDF trends and concludes "design standards should continue to rely upon the long-standing historical data provided by the Windsor Airport station" and that a “stress test” event, a 150 mm rainfall event be applied to assess vulnerabilities and any design adjustments to mitigate unacceptable risk - for new development unacceptable risk would include water levels above lowest building openings on a site. Therefore, IDF values have not been increased in design, but a practical stress test is applied to assess risks and adaptation requirements.

4) City of Ottawa, Ontario Storm Sewers and Stormwater Management Designs

Ottawa reviewed its IDF data in 2015 and found increases and decreases in IDF intensities at different durations and "that the percentage differences in intensities between the IDF curves is within the margin of error associated with data collection and hydrologic assessments, it was ISD’s opinion not to update the OSD IDF curves." A check storm is considered based on climate change research: "The storm sewer system performance also has to be checked for historical storms as well as a 20% increase in the 100 year rainfall volume for climate change stress testing. For these events, there is no requirement for a free board between the footing elevation and the hydraulic grade line elevation."

5) City of Moncton, and Town of Riverview, New Brunswick Major Stormwater System

These municipalities have incorporated a “20% allowance in the historical data of 1 in 100
year storm-major stormwater system” (Mohammed, 2016).

6) City of London, Ontario Subwatershed Studies

In 2011, based on University of Western future climate projections, the City of London resolved to  "increasing the City's existing Intensity Duration Frequency (IDF) Curves by 21% and that Civic Administration BE DIRECTED to incorporate this change in a phased approach starting with the subwatershed studies outlined below and ultimately adjusting other design standards, planning and Official Plan considerations in dialogue with interest parties".

7) Ministry of Transportation, Ontario Highway Drainage

The Ontario Ministry of Transportation (MTO) has comprehensively assessed future climate risks to highway drainage infrastructure including storm sewers, culverts and bridges (see 2015 document The Resilience of Ontario Highway Drainage Infrastructure to Climate Change). It found predicted decreases in short duration rain intensities:

"Predicted storms with durations less than 6 hours are less intense than those observed in 2007, for all return periods. Longer duration storms do not always hold to this pattern, with the 6 and 24 hour storms often predicted to become more intense, particularly in Northwestern Ontario. The magnitude of the difference in rainfall precipitation between the IDF curves, which are based on historical data and those developed from climate models, can be quite significant."

It also found in bias-corrected future climate models both predicted increases and decreases: "In some areas rainfall intensity increased from 0% to just above 30% where in other areas there were rainfall intensity reductions in the from 2 to 10%."

The impacts of a 30% increase in flow rates was found to have limited affect on highway drainage infrastructure:

"Based on the analysis of samples of highway infrastructure components there is demonstrated resilience of MTO drainage infrastructure to rainfall increases as a result of predicted climate change scenarios. An overwhelming percentage of the storms sewer networks tested appeared to have sufficient excess capacity to hand the increases in design flow rates up to 30%. Similarly, the sample of highway culverts analysed showed adequate capacities, for a large percentage of the culvert, to handle the rage of low rate increases investigated without the need to be replaced. The bridges tested also appeared to suffer no risk to structures as a result of the flow increases."

MTO issued a policy on how to consider future climate effects called Implementation of the Ministry’s Climate Change Consideration in the Design of Highway Drainage Infrastructure that indicates designers are to use the IDF Curve Lookup tool and then to consider future IDF values in sizing infrastructure:

"Designers are to exercise engineering judgement to determine whether the infrastructure will meet current and future design criteria through appropriate sizing of the infrastructure or through providing allowances for future adaptation measures."

However, it is noted that MTO does not necessarily adopt the future IDF curve for design and accepts "providing allowances" to adapt to those conditions in the future. This adaptation approach is consistent with the American Society of Civil Engineers' recommended Observational Method approach to managing uncertain future climate risks (see previous post).

Construction Era, Infrastructure Standards and Extreme Rainfall Flood Resiliency and Risk

Flooding occurs largely based on clear and quantifiable municipal infrastructure design standards that have evolved over the last century, steadily reducing flood risk. Certainly factors such as urbanization and intensification affect hydrology and increase runoff and risks, even when rainfall intensities have not changed (e.g., southern Ontario for example) - but fundamental design characteristics that may or may not account for extreme weather effects are the predominant factor affecting urban flood risk.

From Flood Plains to Floor Drains, my unifying theory of urban flood risk, described how planning and design practices have evolved within the realms of riverine flooding (i.e., flood plain management), pluvial flooding (i.e., major overland drainage design), and sewer back-ups (i.e., wastewater and stormwater sewer design). These systems may also interact during extreme weather through processes not explicitly considered in the design and that may accentuate core design limitations, or lower levels or service, in the related system. For example, flood plains may back up into sewer systems (e.g., Carp River, Ottawa or Etobicoke Creek, Toronto). Or overland drainage systems may overwhelm sanitary sewer systems with inflows ... insert your local 'Lost River' example here.

So what are the construction eras and infrastructure servicing standards that characterize extreme weather flood resiliency or risk? Here is an approximate grouping that I developed to support a white paper on Core Public Infrastructure knowledge gaps and research needs for the National Research Council last year. That work did not look into riverine systems but those are included here:

Servicing Era 1 - 1960 and before

Median Flood Risk = HIGH (4 out of 5)

Level of Service Profile:
  • Riverine flood risks are not uncommon, unless structural controls have been put in place (e.g., dams, berms, etc) or land use planning has relocated original at-risk dwellings.
  • Pluvial / overland flood risks exist as it was not a common design practice to accommodate major system flows during extreme rainfall events.
  • Sewer back-up risks exist due to high extraneous flow stresses during extreme rainfall events in combined wastewater systems and partially-separated systems (i.e., with foundation drains / weeping tiles connected to the sewer system). Risks may increase if there is reliance on mechanical and electrical systems (e.g., pumping stations in the collection system) or may decrease if hydraulic relief is available through combined sewer overflows (CSOs) or storm sewer overflows (SSOs).
Other Considerations:
  • CSO or SSO hydraulic relief may have a relatively-smaller moderate flood risk (3 out of 5)
  • Systems serviced by pumping systems that have finite capacity or that are affected by flood plain encroachment may have a relatively-higher highest risk (5 out of 5).
Servicing Era 2 - 1960 to 1980

Level of Service Profile:
  • Riverine flood risks vary overall according to natural hazards land use planning (provincial or local policies) and vary locally based on the spatial extent of flood risk mapping (i.e., have large drainage areas (up to about 125 hectares) been mapped or estimated including through urban areas.
  • Pluvial / overland flood risks exist as it was not a common design practice to accommodate major system flows during extreme rainfall events.
  • Sewer back-up risks exist due to high extraneous flow stresses during extreme rainfall events in partially-separated systems (i.e., with foundation drains / weeping tiles connected to the sewer system). Risks may increase if there is reliance on mechanical and electrical systems (e.g., pumping stations in the collection system).
Median Flood Risk = HIGHEST (5 out of 5)

Other Considerations:
  • Systems with good overland catchment slopes may have a relatively-lower high flood risk, despite no explicit overland drainage system (4 out of 5).
  • Systems serviced by pumping systems that have finite capacity or that are affected by flood plain encroachment may have a relatively-higher risk.
Servicing Era 3 - 1981 to 1990

Level of Service Profile:
  • Riverine flood risks may be significantly reduced according to natural hazards land use planning (provincial or local policies) and can vary locally based on the spatial extent of flood risk mapping (i.e., have large drainage areas (up to about 125 hectares) been mapped or estimated including through urban areas.
  • Pluvial / overland flood risks may exist from jurisdiction to jurisdiction as this design practice was introduced to accommodate major system flows during extreme rainfall events, often in combination with master drainage planning at the early land use planning stage.
  • Sewer back-up risks are limited due to low extraneous flow stresses during extreme rainfall events in fully-separated systems (i.e., no foundation drains / weeping tiles connected to the sewer system). Risks may increase if there is reliance on mechanical and electrical systems (e.g., pumping stations in the collection system).
Median Flood Risk = MODERATE (3 out of 5)

Other Considerations:
  • Systems with good overland catchment slopes, often through explicit dual-drainage design for major system design, may have a relatively-lower low flood risk (2 out of 5).
  • Systems serviced by pumping systems that have finite capacity or that are affected by flood plain encroachment may have a relatively-higher highest risk (4 out of 5).
Servicing Era 4 - 1990 to today

Median Flood Risk = LOW (2 out of 5)

Level of Service Profile:
  • Riverine flood risks are typically significantly reduced according to natural hazards land use planning (provincial or local policies) . Local and downstream risks may be reduced through integrated land use and watershed/subwatershed planning.
  • Pluvial / overland flood risks are limited where the dual-drainage design practice was introduced to accommodate major system flows during extreme rainfall events, often in combination with master environmental servicing (including drainage) planning at the early land use planning stage.
  • Sewer back-up risks are limited due to low extraneous flow stresses during extreme rainfall events in fully-separated systems (i.e., no foundation drains / weeping tiles connected to the sewer system). Risks may increase if there is reliance on mechanical and electrical systems (e.g., pumping stations in the collection system).
Median Flood Risk = MODERATE (3 out of 5)

Other Considerations:
  • Systems with no explicit dual-drainage design for major system design may have a relatively-higher high flood risk (4 out of 5).
  • Systems serviced by pumping systems that have finite capacity or that are affected by flood plain encroachment may have a relatively-higher highest risk (4 out of 5).
Servicing Era 4 Plus - Added Enhanced Best Practices to Servicing Era 4

Median Flood Risk = LOWEST (1 out of 5)

OK, so what are the enhanced best practices that create Era 4+ ? Basically take the good practices in Era 4 and add measures that provide enhanced resiliency in each of the realms.

Enhancements:
  • Riverine flood risk reduced through adoption of higher return period events (e.g., above 100-year level of service) or significant freeboard allowances (safety factors in design).
  • Pluvial / overland risk reduced through provision of adequate freeboard on major drainage system to prevent entry to properties.
  • Sewer back-up risks reduced through mandatory plumbing system isolation (backwater valves and sump pumps), or robust hydraulic design of gravity systems to consider extreme rainfall stresses above 100-year level (e.g., including future projected rainfall intensities) and to consider freeboard to basement systems during extreme events, and inlet control devices to limit storm sewer system surcharge.
A longer list of enhanced-level best practices is found in the Intact Centre on Climate Adaptation seed document on Best Practices for New communities:


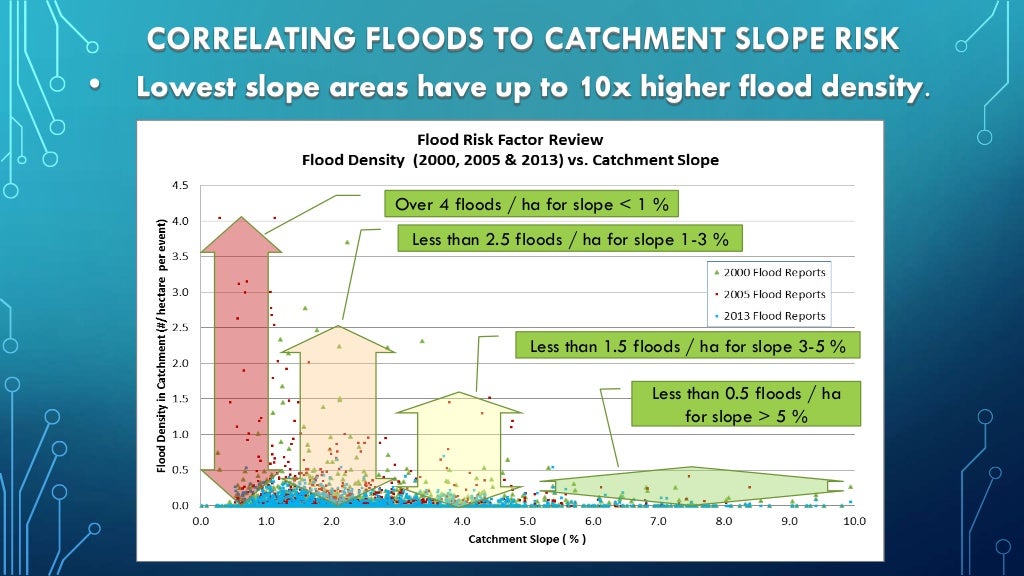
So how do we know these Servicing Eras are relevant and really do affect flood risk? By using data to track reported flooding and correlating the flood density to the servicing era or the characteristic within the servicing era. An example of this is my assessment of overland flow characteristics, and catchment slope characteristics on reported Toronto flood density:


EXAMPLE 1 - OVERLAND DRAINAGE RISKS
Wide Flow
Spread (Low
Slopes)
Basement
Flood Cluster
Basement
Flood Clusters
Basement
...

CORRELATING FLOODS TO CATCHMENT SLOPE RISK
• Lowest slope areas have up to 10x higher flood density.
Over 4 floods / ha fo...

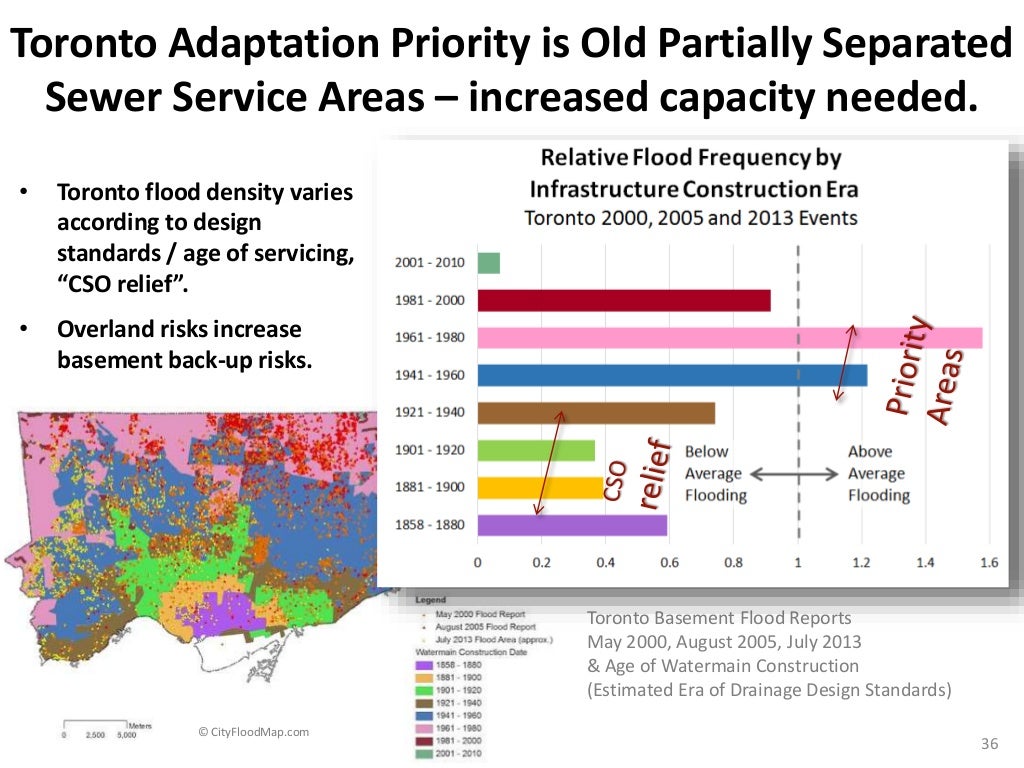
And reviews of flood density in Toronto based on era of construction (I used watermain installation date as a surrogate) (see slide 36):


• Toronto flood density varies
according to design
standards / age of servicing,
“CSO relief”.
• Overland risks increase
b...

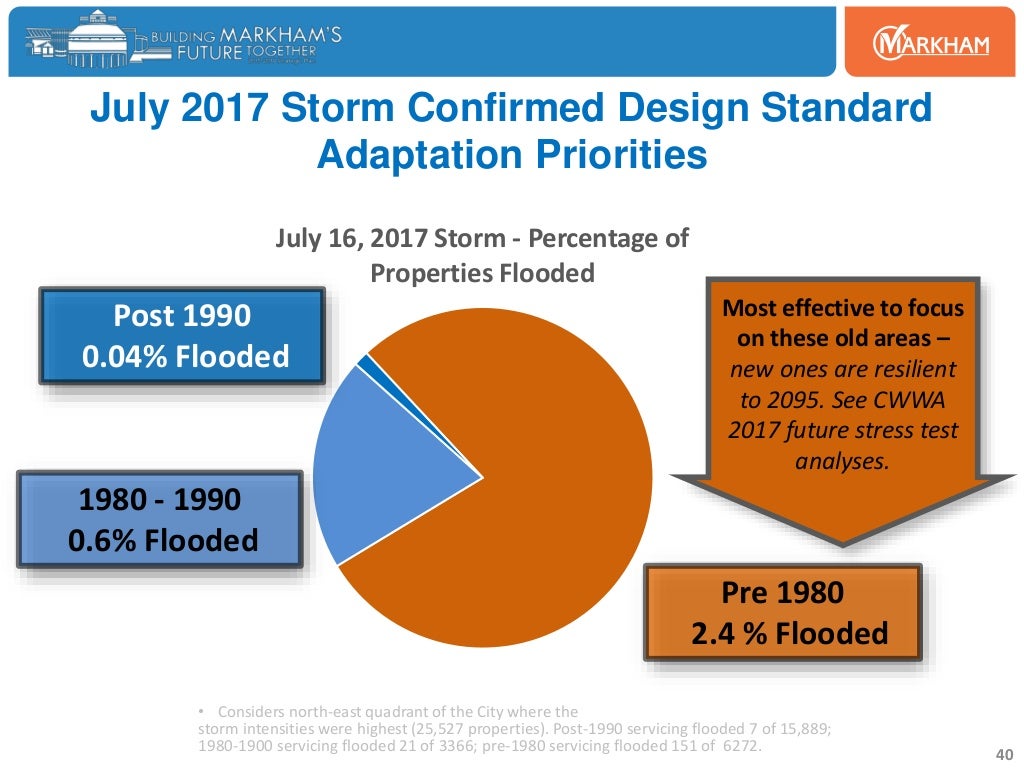
Or in Markham (see slides 39 and 40) in the above link (I used storm sewer installation date).

July 16, 2017 Storm - Percentage of
Properties Flooded
July 2017 Storm Confirmed Design Standard
Adaptation Priorities
Pre...

So what can we expect when we look at the flood risk profile across Canadian cities based on these Servicing Eras? First, we can expect to see a vast variation from city to city based on its growth and servicing history. Using Statistics Canada data on from the 2016 census for Ontario, we can use the date of housing construction as a surrogate for the date of municipal servicing - this approach has limitations because housing may be in place before servicing in isolated cases (i.e., servicing is newer than the housing), and servicing may be upgraded over time (i.e., capacity upgrades to original servicing). The graph below looks at housing/construction eras for census metropolitan areas (CMAs) or smaller geographic units.

We see that areas with more growth (e.g., Milton, Barrie) have less than half the proportion of high and highest risk housing stock (Eras 1 and 2) compared to other low growth areas (e.g., Sudbury, Belleville). The Milton breakdown is shown on the left. Milton has over 70% Era 4 resilient housing built and serviced after 1991 (green shaded slices of the pie), whereas Sudbury has less than 20% of housing in the group. The Sudbury breakdown is also shown on the left.

Milton shows significant growth in the 2001-2005, 2006-2010 and 2011-2016 periods once water and wastewater servicing was available to this part of the Halton Region (previously well water supply limited growth). In contrast, Sudbury shows limited growth post 2006, reflecting perhaps a slowdown in the resources/mining sector following the 2008-2009 recession.


The bar chart totals were for some entire census areas encompassing several municipalities (e.g., the Toronto CMA includes may municipalities including in York Region, Peel Region and Halton Region). Within the CMA or municipalities themselves, the infrastructure construction era will also vary (see Toronto watermain installation date in the slide noted above). For example in the Toronto CMA 47 % of housing is within Era 1 and 2, while in the City of Toronto itself 64 % of housing is within those eras, reflecting older housing stock and servicing in Toronto compared to newer communities such as Mississauga, Markham, Vaughan, etc.. Toronto also has less resilient Era 4 housing stock compared to its CMA, i.e., 26 % vs 39 %, respectively. 

The type of housing must be considered where there is a high proportion of condominium / apartment dwelling types that do not have basements with the same single family dwelling back-up risks and that typically have no riparian flood risks. The City of Toronto housing units are 39% apartment, including many new condominium units, while in the broader Toronto CMA, apartments account for 29%. As a result, the resiliency of areas with a high proportion of newer apartments may be slightly overestimated.

What's next - mapping the Servicing Era and flood risk profile at a census tract level perhaps and netting out the effect of apartments and then adding in other local risk factors that are readily available.

****

And here we go with some neighbourhood variability in era of construction to show the variability in land use planning, subdivision infrastructure servicing and dwelling construction practices across several regions in Canada. The average neighbourhood age is based on Statistics Canada data at a census tract scale - sometimes that is too small a scale to assess risk and sometimes it too big, and sometimes it does not align with infrastructure system servicing boundaries. So what I'm saying is its a high level general characterization of resiliency, and one would have to drill down into specific infrastructure systems to see street by street resiliency :

Vancouver:

 Calgary:
 Golden Horseshoe / Toronto / Hamilton:
 Ottawa / Gatineau:

Montreal:


Halifax:

Other factors that characterize flood risk can also be considered, including overland flow and topographic slopes that contribute to direct surface flooding and also inflows to sanitary sewer systems (e..g, via reverse slope driveways and low opening, or windows and lower level walkouts that ultimately drain to floor drains and the sanitary/wastewater collection system).

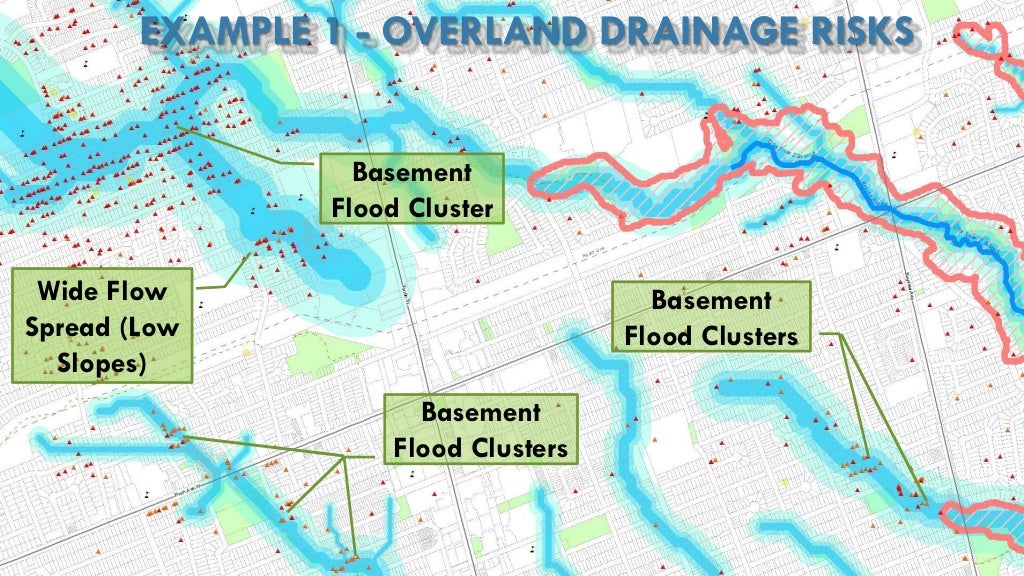
The following images show the estimated 100-year overland flow spread for drainage areas up to 10 hectares in Toronto. Catchments with low slopes are also shown as these have been shown to influence the maximum flood density reported following extreme rainfall events.

The first map shows the Newtonbrook area of North York where the overland conveyance limitations are clearly apparent. It would appear that the topographic drainage limitations (low slopes, no overland outlet) combined with the age of construction (with partially-separated sanitary sewers) results in the high relative flood risk.


I have to say it is tempting to cherry pick the map area to prove my hypothesis is correct in terms of flood risk factors. The west end Toronto map shows the limitations in flood risk factors. For example the greatest flooding in May 2000 was not in the low slope catchments or the oldest construction area but rather in a cluster north west of Eglinton Ave West and Islington Avenue. The oldest area to the south shows one flood cluster on the overland flow path but not throughout the old area for the May 2000 event. So is construction age alone a good indicator of risk? Overall it is (analysis of all Toronto flood reports proves it is relevant), but it breaks down at the neighbourhood or sub-neighbourhood level as a predictor of risk. The best indicator of risk? Past flooding. Why? Because the complex reality of hydrologic and hydraulic systems and building construction cannot be readily simplified into list of risk factors - there is too much variability, too many exceptions and too much interaction between known and unknown factors to identify risk at a fine spatial scale.


The final map below shows another west end area where 10 hectare overland flow paths help explain some flood clusters but not others. Slope does not seen to be a driving factor where the overland drainage area is small (near Trethewey Drive), but may be a more significant factor on Jane Street where the overland flow area is more significant. What this shows is that it is combinations of factors that accentuate overall flood risk. If one factor is quite severe, it can trigger a flood cluster like east of Dufferin Street, north of Lawrence Avenue West where the age of construction is newer, slopes are good but the overland flow system behaviour alone is enough to trigger risks. Like there previous map, this one shows cluster that are off the major overland flow paths - so these do characterize risk on an aggregate basis overall, but not always at a local spatial scale.

This is perhaps the best example of overland flow risks coming to life like a 'giant tiger' during a severe storm. The picture is from Twitter at .. ummm .. the Giant Tiger store on Kipling Avenue. The store is immediately on the overland flow path - not a huge drainage area, but the building effectively blocks the flow path. The low slopes (orange polygon) around the store suggest it is in a 'bowl' (like Newtonbrook in the image above), which means the overland flow has 'nowhere to go' - good overland slopes help 'move' runoff during an extreme event. 


Looking at Mississauga, and reported flooding from July 8, 2013 one can see higher concentrations in older areas closer to Lake Ontario and in Malton (top of inset map). Newer areas that appear to have low densities of flood reports may in fact just be commercial properties with no basements and with owners or tenants who did not report flooding to the City after the storm event (e.g., areas surrounding Pearson Airport). It does appear that relatively less flooding was experienced in newer subdivisions to the west (e.g., Erin Mills).

Adding other factors such as overland flow paths to the Mississauga flooding and construction era maps shows again, like in some Toronto maps, that the combination of factors drives flood risks. Clearly higher densities of flooding within older neighbourhoods (census tracts) can be found along overland flow paths (note regulated floodplains are not shown). The tributary west of Cawthra Road between the QEW and the CNR in the Mineaola neighbourhood shows a clear line of reported flooding along the overland flow path. Other local areas in the Mineola neighbourhood do not have a high degree of reported flooding, despite the older age of building construction and servicing standards - some flooding in that neighbourhood is associated with Cooksville Creek riparian flooding risks.

Edmonton has mapped overland flooding risk areas to help educate residents on flood risks. The map below illustrates the variability in dwelling construction date across census tracts.


The following map shows areas with surcharged sewers and surface ponding risks based on the interactive map available here: http://edmontonjournal.com/news/local-news/first-defence-new-epcor-ranking-scheme-may-wake-up-neighbourhoods-to-flood-risk.

What does it show? Old areas south of the rail tracks have higher sewer surcharge risk (red pipes), corresponding to the old 'grid pattern' development. Newer areas to the north, especially north of 153 Avenue NW have very few sewer surcharge risk (i.e., fully separated sanitary sewer servicing) - those are the areas with the modern 'wiggly' road patterns. Its all coming together !


The City of Windsor experienced extensive flooding in both 2016 and 2017. The following map illustrates August 2017 flood reports.
The era of construction is shown in the map below. It would appear that oldest areas had the highest flooding reports, and newest areas (e.g., in the west) had lower flood density.


Looking back at Mississauga, we have analyzed the flood density in residential development areas by era of construction, using weighted average construction date in each census tract. The flooding locations were estimated through digitizing and therefore likely underestimate reports in the highest density areas due to overlapping symbols. Nonetheless, a strong trends appears in the data with a lower density of flooding for 1980-1989 construction compared to pre-1980 construction - this reflects the benefits of full sanitary sewer separation and more advance master drainage planning. Post-1990 construction areas show even lower flood density that 1980-1990. The ratio of flooding density in the three eras of pre-1980, 1980-1989, 1990-present was 3.1 - 1.8 - 1. Unlike the Markham densities above that are based on total dwelling counts, the Mississauga densities area are-based and therefore if modern dwelling densities are higher, the relative flooding would be even lower for more modern construction (i.e., more dwelling per area, resulting in even lower flooding per dwelling). The following map illustrate the residential areas (with the exception of Malton), colour-coded by construction era and estimated flood locations.


Looking a little closer at Mississauga and the major overland drainage system, con can see the influence on reported flooding. Older construction areas do not have uniform flood risks - while risks are higher overall, on an aggregate basis in older vs modern drainage systems, with the older areas there are distinct clusters of flooding. Often  those clusters are along a regulated valley feature or along an major overland flow path upstream of the regulated area - several examples can be seen in the map. The inset at the top right is the Malton area of Mississauga - flooding clusters are apparent along the major overland flow path beyond regulated areas - this does not necessarily mean flooding was overland, pluvial flooding, but that the major system conveyance limitations stressed the sanitary sewer system, for example, with extraneous inflows in an area that already has high infiltration flows.

***

Two key flood risk factors are combined in the following map showing the City of Waterloo. Spatial analysis of overland flow path hydrologic characteristics are intersected with city sanitary sewer system age and inferred infiltration and inflow risk to identify risk areas of interest - these can be assessed through further study, whether that be investigation of critical system conditions (e.g., CCTV inspection), monitoring of flow stresses to confirm inflow potential sewer surcharge risk magnitude,  to modelling / quantification of flood risks, or further risk characterization through investigation of past flood claims and reports. Average dwelling age of construction in census areas is labelled to show the general correlation of broad neighbourhood risk factors (i.e., construction era is a surrogate for sewer and overland drainage design standard resiliency). Individual dwellings near the overland flow path are shown in red, indicating specific local risks within new and old subdivisions.

City of Waterloo - Example Urban Flood Risk Factor Review Considering 100-Year Overland Flow Risks and Sanitary Sewer Resiliency Based on Construction Era and Inflow / Infiltration Potential (Excludes Riverine Flood Risk and Properties in Regulatory Flood Plain)
Methods for assessing urban and riverine flood risks from "Flood Plains to Floor Drains" are discussed in a previous post.

Design Standard Adaptation vs. Climate Change Adaptation for Urban Flood Risk Mitigation

New design standards are tigers.
Old ones are lambs.
New analysis on historical flooding during Toronto extreme weather, and observed wastewater flows in Ottawa prove it: Design Standard Adaptation is needed for urban flood risk management instead of Climate Change Adaptation - the same can be said for other southern Ontario municipalities.

That is, upgrading infrastructure capacity is required to account for significant increases in level of service, as opposed to upgrading for rainfall intensity trends which have been static. But rain causes flooding, right? Wrong. Let's look at the facts.

Rain doesn't directly cause flooding. Rain causes runoff, runoff accumulates as flow in drainage systems (or as extraneous flow in wastewater systems). It is ultimately infrastructure flow conveyance capacity, or lack thereof, that causes flooding. Both runoff conveyance capacity and extraneous flow stresses have changed significantly over the decades in Ontario and other jurisdictions, due to new design standards.

So why is there a fixation only on rain and climate when discussing adapting for flood risk? Clearly, other processes and factors related to urban hydrology (increased runoff) and infrastructure hydraulic capacity (constrained sewers and blocked overland flow paths) can better explain flooding instead of rain and climate. Yes those are quantifiable factors.

But let's break it down, showing only how design standards have addressed flow stresses and system capacities by considering:

1) Rain intensities ARE NOT increasing
2) Design standard capacity (level of service) HAS increased
3) Historical flooding is concentrated in areas with OLD STANDARDS and low levels of service
4) Pre-1980's areas need adaptation to today's more robust design standards

1) Rain intensities are not increasing

Has rainfall intensity increased in southern Ontario? Environment and Climate Change Canada's Engineering Climate Dataset version 2.3 say NO! There are more statistically significant decreases in intensity than increases, especially for the short duration intensities that drive urban flooding. Here is the data:

Ontario climate change myth cap and trade policy climate adaptation ROI
Short duration Southern Ontario rainfall intensities trends are mostly insignificant (randomly up and down) and are decreasing for short durations linked to urban flash flooding in overland drainage and sewer systems.

Ontario climate change myth cap and trade policy climate adaptation ROI
More statistically significant DECREASES in rainfall intensity are observed than increases.


Toronto climate change extreme weather hoax
Annual maximum rain intensities are DECREASING for all durations of 5 minutes to 24 hours at the long term Toronto climate station. Decreasing trends are statistically significant for the 6, 12 and 24 hour durations.

2) Design standard capacity (level of service) HAS increased

Storm Drainage / Runoff Flow Conveyance

Many municipalities had storm sewer capacities based on 2-year to 5-year return period rainfall intensities. This basic level of service for the 'minor' underground convenience system is characteristic of urban drainage system build before the 1980's, when dual drainage design emerged, adding 'major' overland flow capacity to the level of service to handle extreme rainfall. The earliest a Toronto-area municipality incorporated overland flow capacity into its design standards was 1978. Typically, a 100-year return period level of service is now provided for the major system. This represents about a 250% increase in system capacity as shown below.

Design standards increase level of service over time significantly - about 250% for old, pre-1980's 2-year minor-only systems to 1980's dual drainage 100-year systems, including overland flow component.

This is an excerpt from a late 1970's dual drainage standard in Ontario:

Dual drainage design standard incorporating minor sewer and major overland system capacity to avoid flooding into basements during 'heavy storms'.
Other cities have moved to the 100 year capacity standard through the 1980's. Calgary describes the chronology of drainage standard improvements, indicates improved drainage capacity standards in 1988: "The designed capacity for storm drainage systems in new communities is increased to handle one-in-one-hundred-year rainfalls (the former standard was one-in-five-year rainfalls - in some of the older communities, the standard was one-in-two-year rainfalls)."


Sanitary Drainage / Wet Weather Stress Reductions

Extraneous flows in wastewater systems (that stress infrastructure capacity, causing back-ups) have decreased dramatically as a result of updated design standards, resulting in a significant increases in level of service during extreme wet weather (i.e., lower flood risk in newer subdivisions). The transition to fully separated sewers from partially separated sewers, i.e., connecting foundation drains to the large storm sewer instead of the smaller wastewater sewer before the mid 1970's, decreases the 100 year extraneous flow in the wastewater system by 82% based on Ottawa's extensive monitoring and analysis. This is a significant reduction in flood stress in newer, post mid-1970's subdivisions.
drainage design standard urban basement flood risks I&I Ottawa
Extraneous inflow and infiltration to wastewater system sanitary sewers decreased dramatically with complete sewer separation (foundation drains connected to large storm instead of smaller sanitary sewers).

drainage design standard urban basement flood risks I&I Ottawa
Fully separated sanitary sewer systems have high level of service.
The lower extraneous wet weather flows, result in less sewer surcharge and basement back-up flood potential, as shown in the difference in return period level of service in systems with different design standards. Newer separated sewer systems have a 100 year level of service while older partially separated sewers (with 550% more wet weather flow) have a lower level of service - the capacity varies by system and by catchment size, showing in larger areas where extraneous flow are cumulative, the level of service is less than 50 year in example systems. Results are in the table at right. 

3) Historical flooding is concentrated in areas with OLD STANDARDS and low levels of service

Flood reports across the City of Toronto data for May 2000, August 2005 and July 2013 extreme storms were used to estimate the date of construction and the era of the drainage design practices. The age of watermain installation was used to estimate era, recognizing that in some instances of watermain replacement have occurred since the time of the original drainage design. The following map shows the era of watermain installation and flood sites.

Toronto Watermain Installation Dates (Estimate of  Drainage Design Standard Era) and Historical Flood Reports


This table shows the proportion of addresses reporting flooding in those three events, normalized by the total number of addresses in each era. Post-1980's construction show decreasing relative flood risk.
design standard adaptation ontario drainage Toronto flood sites

What does it show? Pre 1980 areas (1941 - 1980) have relatively higher flood risks and newer post-1980 areas have lower risks, reflecting better design standards. Why such low flooding in old combined sewer areas? Perhaps CSO relief in those systems, perhaps that August 2005 and July 2013 storms did not hit downtown as hard? Those are some possibilities.

4) Pre-1980's areas need adaptation to today's more robust design standards

Old urban areas built with only 2 year storm sewer capacity may have only 40% of the runoff conveyance capacity of newer, post 1980's areas that have 100-year dual drainage conveyance systems (100 year rain intensities and flow capacity can be 250% above 2 year capacity systems). And old areas built before the mid 1970's, with partially separated sanitary sewers, can have on average over 550% greater extraneous wet weather loads, stressing the wastewater system significantly during 100 year storms.

Since rainfall intensities have not increased, and design standards for storm and sanitary systems have changed dramatically since the 1970's and 1980's, Design Standard Adaptation is needed for urban flood risk management instead of Climate Change Adaptation. Here we summarize the whole post in a single cool bar chart:

Storm runoff conveyance capacity has increased with new standards, and sanitary extraneous wet weather flow stresses (inflow and infiltration) have decreased with new standards, while rainfall intensity conditions have remained static in Southern Ontario - obviously design standard adaptation is needed in older urban areas to mitigate urban flood risks including sewer back-up and overland flood perils. Runoff capacity has increased 250%, and 82% of sanitary flow stresses have been eliminated, due to current design standards.
***
More details: runoff increases with intensification, with the amount of impermeable, high runoff surfaces more than doubling over a 50 year period in some municipalities:


Rainfall intensity increases have been been reported by insurance media, confusing theoretical shifts with actual Environment Canada historical data:


Design standard adaptation trumps climate change mitigation !

The grade 10 kid who first said "“Our underground storm
sewers can’t handle the rainfall we get these days.”
also gave us this very lovely art project.
It looks like the guys at ICLR is getting on track with some much awaited myth-busting ..err ... "chestnut" cracking as they call it :

Chestnut: Our storm sewers can’t handle today’s extremes, they never really could

Nutty Myth: climate change is causing flooding in our cities, 100 year storms are getting worse

Nut-Free Truth: many of our drainage systems were only designed for 2 year storms

Of course the engineering community has know this for years. But it is a revelation to the insurance industry that the chestnut " “Our underground storm sewers can’t handle the rainfall we get these days.” ... was actually written by a grade 10 geography student who read it first on Wikipedia. The insurance industry has claimed that we are getting 20 times more storms than we used to - 20 time more storms chestnut cracked - thankfully the CBC Ombudsman checked with Environment Canada after our complaint and fixed that nutty story.

Here is my response to the ICLR inblog post (since insblog.com usually doesn't publish my comments that push the envelope in any way):

****

Thank you Glenn for promoting this ("Our storm sewers can't handle today's extremes, they never really could") – we all need to emphasize design standard adaption to prevent flooding, not climate change mitigation.

As an example, storm sewer capacities have been increased up to 400% to adapt to a higher level of service (up to 100 year) in the GTA municipality where I have developed the long term flood control program. Local rainfall intensities are decreasing for most durations at our local airport, just like many southern Ontario rain gauges. So rain is not the issue.

1960's development with 5 year storm capacity.
This is how it was designed to work with a very
low level of service compared to new standards.
One factor not noted in the post is the interaction of the major overland system with the sanitary sewer system in older, pre 1970’s areas, particularly because of the risk of extraneous inflows that overwhelm the sanitary system during extreme events. Our experience is that late-1970’s areas with somewhat limited major overland drainage networks have relatively low flood risks if the sanitary sewer is fully separated (that is foundations drains go to the storm and not the sanitary).

In the municipality where I work we have mapped the overland flow paths, and determined estimated ponding depths using an elevation model to identify areas to seal sanitary manholes from overland inflows and have disconnected downspouts in the high inflow areas to manage that risk factor. This has proven to be an effective approach in an area that had extensive flooding in August 2005 but very little in July 2014 – this was achieve with relatively low cost measures (i.e., downspout disconnection and pick hole plugs). And this risk reduction was achieved prior to storm sewer upgrades.

I’m guest lecturing in the Civil Engineering class at Ryerson this Monday and I will highlight the nod to their site!

Rob M

****

The real irony here is that the chestnut that ICLR is busting is actually from their own 'research' into rainfall trends that stated that a "rising frequency and severity of extreme weather events" is responsible for floods. That nutty myth has been thoroughly cracked:


****

CityFloodMap.Com
Cracking nuts since 2013
The other truth is that the previous major flow paths we used to have have been compromised (filled in, enclosed, etc.) due to urbanization and the residual lost rivers have been correlated with basement flooding risks. Here are some examples of that:

Yesterday's Lost Rivers are tomorrow's flooded basements

More Toronto Lost Rivers

If you are interested in more data, tables and mapping on extreme rainfall trends in Canada then take a gander at the following links:

Static Maps: http://www.cityfloodmap.com/2015/12/severe-storm-trends-canada-rainfall.html
Interactive Map: http://www.cityfloodmap.com/2015/12/canadian-extreme-rainfall-map-climate.html
Table Summaries: http://www.cityfloodmap.com/2015/12/canadian-extreme-rainfall-summary-by.html
Chart and Table: http://www.cityfloodmap.com/2015/12/top-weather-story-in-canada-2015-less.html
Long-term Station Table: http://www.cityfloodmap.com/2015/12/long-term-climate-change-short-term.html
Environment Canada Denies Changes: http://www.cityfloodmap.com/2015/10/bogus-statements-on-storms-in-cbcnewsca.html
Contradicting Insurance Industry Claims: http://www.cityfloodmap.com/2015/12/trends-in-canadian-shortduration.html