Design Standard Adaptation vs. Climate Change Adaptation for Urban Flood Risk Mitigation

New design standards are tigers.
Old ones are lambs.
New analysis on historical flooding during Toronto extreme weather, and observed wastewater flows in Ottawa prove it: Design Standard Adaptation is needed for urban flood risk management instead of Climate Change Adaptation - the same can be said for other southern Ontario municipalities.

That is, upgrading infrastructure capacity is required to account for significant increases in level of service, as opposed to upgrading for rainfall intensity trends which have been static. But rain causes flooding, right? Wrong. Let's look at the facts.

Rain doesn't directly cause flooding. Rain causes runoff, runoff accumulates as flow in drainage systems (or as extraneous flow in wastewater systems). It is ultimately infrastructure flow conveyance capacity, or lack thereof, that causes flooding. Both runoff conveyance capacity and extraneous flow stresses have changed significantly over the decades in Ontario and other jurisdictions, due to new design standards.

So why is there a fixation only on rain and climate when discussing adapting for flood risk? Clearly, other processes and factors related to urban hydrology (increased runoff) and infrastructure hydraulic capacity (constrained sewers and blocked overland flow paths) can better explain flooding instead of rain and climate. Yes those are quantifiable factors.

But let's break it down, showing only how design standards have addressed flow stresses and system capacities by considering:

1) Rain intensities ARE NOT increasing
2) Design standard capacity (level of service) HAS increased
3) Historical flooding is concentrated in areas with OLD STANDARDS and low levels of service
4) Pre-1980's areas need adaptation to today's more robust design standards

1) Rain intensities are not increasing

Has rainfall intensity increased in southern Ontario? Environment and Climate Change Canada's Engineering Climate Dataset version 2.3 say NO! There are more statistically significant decreases in intensity than increases, especially for the short duration intensities that drive urban flooding. Here is the data:

Ontario climate change myth cap and trade policy climate adaptation ROI
Short duration Southern Ontario rainfall intensities trends are mostly insignificant (randomly up and down) and are decreasing for short durations linked to urban flash flooding in overland drainage and sewer systems.

Ontario climate change myth cap and trade policy climate adaptation ROI
More statistically significant DECREASES in rainfall intensity are observed than increases.


Toronto climate change extreme weather hoax
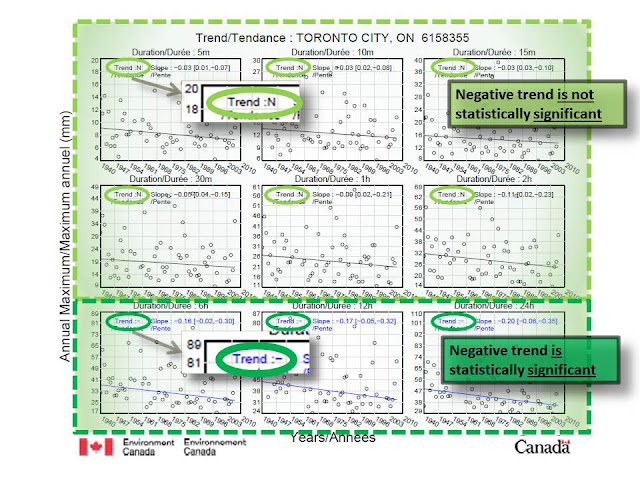
Annual maximum rain intensities are DECREASING for all durations of 5 minutes to 24 hours at the long term Toronto climate station. Decreasing trends are statistically significant for the 6, 12 and 24 hour durations.

2) Design standard capacity (level of service) HAS increased

Storm Drainage / Runoff Flow Conveyance

Many municipalities had storm sewer capacities based on 2-year to 5-year return period rainfall intensities. This basic level of service for the 'minor' underground convenience system is characteristic of urban drainage system build before the 1980's, when dual drainage design emerged, adding 'major' overland flow capacity to the level of service to handle extreme rainfall. The earliest a Toronto-area municipality incorporated overland flow capacity into its design standards was 1978. Typically, a 100-year return period level of service is now provided for the major system. This represents about a 250% increase in system capacity as shown below.

Design standards increase level of service over time significantly - about 250% for old, pre-1980's 2-year minor-only systems to 1980's dual drainage 100-year systems, including overland flow component.

This is an excerpt from a late 1970's dual drainage standard in Ontario:

Dual drainage design standard incorporating minor sewer and major overland system capacity to avoid flooding into basements during 'heavy storms'.
Other cities have moved to the 100 year capacity standard through the 1980's. Calgary describes the chronology of drainage standard improvements, indicates improved drainage capacity standards in 1988: "The designed capacity for storm drainage systems in new communities is increased to handle one-in-one-hundred-year rainfalls (the former standard was one-in-five-year rainfalls - in some of the older communities, the standard was one-in-two-year rainfalls)."


Sanitary Drainage / Wet Weather Stress Reductions

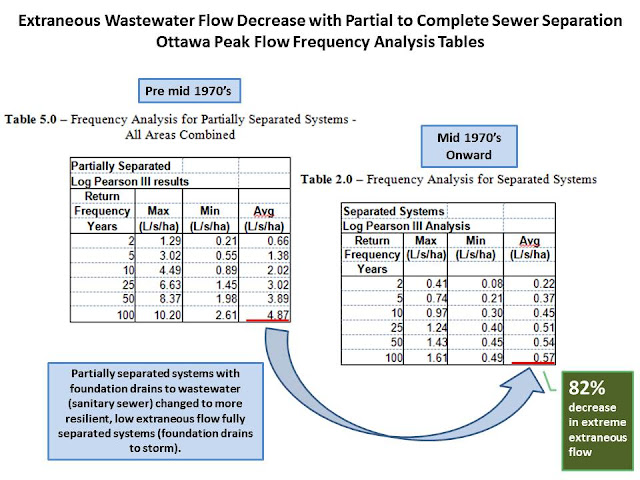
Extraneous flows in wastewater systems (that stress infrastructure capacity, causing back-ups) have decreased dramatically as a result of updated design standards, resulting in a significant increases in level of service during extreme wet weather (i.e., lower flood risk in newer subdivisions). The transition to fully separated sewers from partially separated sewers, i.e., connecting foundation drains to the large storm sewer instead of the smaller wastewater sewer before the mid 1970's, decreases the 100 year extraneous flow in the wastewater system by 82% based on Ottawa's extensive monitoring and analysis. This is a significant reduction in flood stress in newer, post mid-1970's subdivisions.
drainage design standard urban basement flood risks I&I Ottawa
Extraneous inflow and infiltration to wastewater system sanitary sewers decreased dramatically with complete sewer separation (foundation drains connected to large storm instead of smaller sanitary sewers).

drainage design standard urban basement flood risks I&I Ottawa
Fully separated sanitary sewer systems have high level of service.
The lower extraneous wet weather flows, result in less sewer surcharge and basement back-up flood potential, as shown in the difference in return period level of service in systems with different design standards. Newer separated sewer systems have a 100 year level of service while older partially separated sewers (with 550% more wet weather flow) have a lower level of service - the capacity varies by system and by catchment size, showing in larger areas where extraneous flow are cumulative, the level of service is less than 50 year in example systems. Results are in the table at right. 

3) Historical flooding is concentrated in areas with OLD STANDARDS and low levels of service

Flood reports across the City of Toronto data for May 2000, August 2005 and July 2013 extreme storms were used to estimate the date of construction and the era of the drainage design practices. The age of watermain installation was used to estimate era, recognizing that in some instances of watermain replacement have occurred since the time of the original drainage design. The following map shows the era of watermain installation and flood sites.

Toronto Watermain Installation Dates (Estimate of  Drainage Design Standard Era) and Historical Flood Reports


This table shows the proportion of addresses reporting flooding in those three events, normalized by the total number of addresses in each era. Post-1980's construction show decreasing relative flood risk.
design standard adaptation ontario drainage Toronto flood sites

What does it show? Pre 1980 areas (1941 - 1980) have relatively higher flood risks and newer post-1980 areas have lower risks, reflecting better design standards. Why such low flooding in old combined sewer areas? Perhaps CSO relief in those systems, perhaps that August 2005 and July 2013 storms did not hit downtown as hard? Those are some possibilities.

4) Pre-1980's areas need adaptation to today's more robust design standards

Old urban areas built with only 2 year storm sewer capacity may have only 40% of the runoff conveyance capacity of newer, post 1980's areas that have 100-year dual drainage conveyance systems (100 year rain intensities and flow capacity can be 250% above 2 year capacity systems). And old areas built before the mid 1970's, with partially separated sanitary sewers, can have on average over 550% greater extraneous wet weather loads, stressing the wastewater system significantly during 100 year storms.

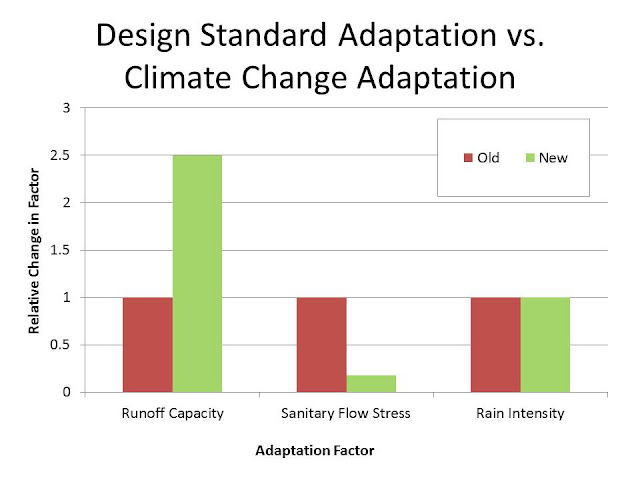
Since rainfall intensities have not increased, and design standards for storm and sanitary systems have changed dramatically since the 1970's and 1980's, Design Standard Adaptation is needed for urban flood risk management instead of Climate Change Adaptation. Here we summarize the whole post in a single cool bar chart:

Storm runoff conveyance capacity has increased with new standards, and sanitary extraneous wet weather flow stresses (inflow and infiltration) have decreased with new standards, while rainfall intensity conditions have remained static in Southern Ontario - obviously design standard adaptation is needed in older urban areas to mitigate urban flood risks including sewer back-up and overland flood perils. Runoff capacity has increased 250%, and 82% of sanitary flow stresses have been eliminated, due to current design standards.
***
More details: runoff increases with intensification, with the amount of impermeable, high runoff surfaces more than doubling over a 50 year period in some municipalities:


Rainfall intensity increases have been been reported by insurance media, confusing theoretical shifts with actual Environment Canada historical data:

Myth Busting on Climate Change and Flooding - aka Nutella is Really Sugar and Oil !

Healthy? or Bumgravy?
Media and advertising can convince you of anything. Like "Nutella is wholesome and good for you" - made with milk and nuts, when the first 2 ingredients are actually sugar and oil - its more like Bumgravy!

Here's our top list of myths (spread through the media like sweet, oily Nutella) about climate change and flooding that deserve some truth:

(1)

Myth: Rain intensity and frequency has increased due to climate change (MOECC, Environmental Commissioner of Ontario, Ontario Government, IBC, ICLR, etc.).
Infographic Bumgravy.
100% data-free !!!!

Truth, rain intensities are not increasing according to Environment and Climate Change Canada's published research based on the Engineering Climate Datasets (version 2.3).

(2)

Myth: Extreme weather events that occurred every 40 years are now occurring every 6 years due to climate change (IBC, ICLR in Telling the Weather Story).


Truth: Maybe worst blunder ever published! IBC / ICLR mixed up a theoretical bell curve shift with actual data - the worst part is they won't admit it and a chief economist at major Canadian bank has repeated the false data claim on historical trends.

(3)

Myth: We are having 20 times more storms now than we used to and that is causing insurance rates to go up.

Truth: The balance sheets of P&C companies is more complicated that this, especially plummeting fixed income earnings in a low interest rate environment that cannot offset underwriting losses anymore .. but that is off track. Environment and Climate Change Canada, through a complaint to the CBC Ombudsman, has corrected this bogus statement as we are not getting more storms. Period.

(4)

Known flood zone. Deeper flood weeks before on May 28-89.
Help stop the Bumgravy Train and tell the truth about flood
causes in Canada ! This was only between a 2 year and a 5 year
design flow rate for the Don River at the Todmorden gauge.
Myth: The GO Train Flood on July 8, 2013 was due to unprecedented conditions is evidence of climate change impacts to weather (Metrolinx, Environmental Commissioner of Ontario).

Truth: A higher flood occurred on May 28-29 just weeks before - so not unprecedented. It was less than a 5 year flood flow rate in the Don River per the Todmorden gauge records - so not a climate extreme. Rail flooding has been documented since the early 1980's flood inquiry to Premier Davis. This was an operational mistake, sending a train into a documented high risk zone at the wrong time during a moderate flow event.

(5)

Myth: Aging infrastructure is reducing capacity causes flooding (most media).

Truth: This has never been cited as a cause of flooding in any of the Municipal Class EA's .. is it possible an advanced City that spends a million dollars per study missed this cause of 'aging'? Check out the Toronto program or Council reports and see if there is any example of 'aging' and share it with us.


****

More: Chestnut cracking on sewer infrastructure capacity.

Design standard adaptation trumps climate change mitigation !

The grade 10 kid who first said "“Our underground storm
sewers can’t handle the rainfall we get these days.”
also gave us this very lovely art project.
It looks like the guys at ICLR is getting on track with some much awaited myth-busting ..err ... "chestnut" cracking as they call it :

Chestnut: Our storm sewers can’t handle today’s extremes, they never really could

Nutty Myth: climate change is causing flooding in our cities, 100 year storms are getting worse

Nut-Free Truth: many of our drainage systems were only designed for 2 year storms

Of course the engineering community has know this for years. But it is a revelation to the insurance industry that the chestnut " “Our underground storm sewers can’t handle the rainfall we get these days.” ... was actually written by a grade 10 geography student who read it first on Wikipedia. The insurance industry has claimed that we are getting 20 times more storms than we used to - 20 time more storms chestnut cracked - thankfully the CBC Ombudsman checked with Environment Canada after our complaint and fixed that nutty story.

Here is my response to the ICLR inblog post (since insblog.com usually doesn't publish my comments that push the envelope in any way):

****

Thank you Glenn for promoting this ("Our storm sewers can't handle today's extremes, they never really could") – we all need to emphasize design standard adaption to prevent flooding, not climate change mitigation.

As an example, storm sewer capacities have been increased up to 400% to adapt to a higher level of service (up to 100 year) in the GTA municipality where I have developed the long term flood control program. Local rainfall intensities are decreasing for most durations at our local airport, just like many southern Ontario rain gauges. So rain is not the issue.

1960's development with 5 year storm capacity.
This is how it was designed to work with a very
low level of service compared to new standards.
One factor not noted in the post is the interaction of the major overland system with the sanitary sewer system in older, pre 1970’s areas, particularly because of the risk of extraneous inflows that overwhelm the sanitary system during extreme events. Our experience is that late-1970’s areas with somewhat limited major overland drainage networks have relatively low flood risks if the sanitary sewer is fully separated (that is foundations drains go to the storm and not the sanitary).

In the municipality where I work we have mapped the overland flow paths, and determined estimated ponding depths using an elevation model to identify areas to seal sanitary manholes from overland inflows and have disconnected downspouts in the high inflow areas to manage that risk factor. This has proven to be an effective approach in an area that had extensive flooding in August 2005 but very little in July 2014 – this was achieve with relatively low cost measures (i.e., downspout disconnection and pick hole plugs). And this risk reduction was achieved prior to storm sewer upgrades.

I’m guest lecturing in the Civil Engineering class at Ryerson this Monday and I will highlight the nod to their site!

Rob M

****

The real irony here is that the chestnut that ICLR is busting is actually from their own 'research' into rainfall trends that stated that a "rising frequency and severity of extreme weather events" is responsible for floods. That nutty myth has been thoroughly cracked:


****

CityFloodMap.Com
Cracking nuts since 2013
The other truth is that the previous major flow paths we used to have have been compromised (filled in, enclosed, etc.) due to urbanization and the residual lost rivers have been correlated with basement flooding risks. Here are some examples of that:

Yesterday's Lost Rivers are tomorrow's flooded basements

More Toronto Lost Rivers

If you are interested in more data, tables and mapping on extreme rainfall trends in Canada then take a gander at the following links:

Static Maps: http://www.cityfloodmap.com/2015/12/severe-storm-trends-canada-rainfall.html
Interactive Map: http://www.cityfloodmap.com/2015/12/canadian-extreme-rainfall-map-climate.html
Table Summaries: http://www.cityfloodmap.com/2015/12/canadian-extreme-rainfall-summary-by.html
Chart and Table: http://www.cityfloodmap.com/2015/12/top-weather-story-in-canada-2015-less.html
Long-term Station Table: http://www.cityfloodmap.com/2015/12/long-term-climate-change-short-term.html
Environment Canada Denies Changes: http://www.cityfloodmap.com/2015/10/bogus-statements-on-storms-in-cbcnewsca.html
Contradicting Insurance Industry Claims: http://www.cityfloodmap.com/2015/12/trends-in-canadian-shortduration.html