Short Duration Frequent Rainfall Show No Change in Southern Ontario IDF Design Intensities - No Change in Averages Suggests No Change in Extremes

It is often stated that changes in average conditions are an indicator of changes in extreme conditions. This makes sense for rainfall statistics as a change in typical conditions, such as an increase in rainfall intensities, can be accompanied by higher extreme values as well (i.e., the whole distribution shifts). Since extreme values are somewhat elusive to those recording rainfall intensities at Canadian climate stations - that is, they are rare and may not be readily observed in short records or sparsely-spaced climate stations - we can look at the trends in the more abundant and frequent short duration rainfall statistics as an indicator of where the extreme values are heading.

The following table summarizes trends in short duration rainfall intensities for long term Southern Ontario climate stations (below latitude of 44 degrees). Stations have at least 30 years of record. The change in 2-year 5 minute rainfall intensity and 5-year 10 minute rainfall intensity have been calculated using a starting point of then Environment Canada's 1990 IDF tables (obtained from Environment and Climate Change Canada in 2017), and an ending point of the Version 2.3 Engineering Climate Datasets.

Climate change rainfall
Change in average and frequent rainfall intensities in southern Ontario.
The review indicates that there has been no increase in frequent short duration rainfall intensities. In fact the most frequent 2-year (i.e., average), 5-minute duration rainfall intensities have decreased somewhat. This is welcome news considering the potential for frequent storms to cause erosion in southern Ontario streams. This also suggests that extreme rainfall intensities have not changed as a result of the average rainfall intensities changing. That is, there is no consistent shift in the average rainfall intensities at long term climate stations.

The Insurance Bureau of Canada and the Institute for Catastrophic Loss Reduction have reported that average rainfall intensities have shifted by an entire standard deviation (thus making extreme 40 year storms become more frequent 6 year storms) - this has been refuted by Environment and Climate Change Canada (see Canadian Underwriter editor's note). The data in the above table indicate no such shift.

It is a commonly held belief that rainfall intensities have increased dramatically as a result of climate changes effects. Recently the Globe and Mail reported "It is hard to ignore the growing relationship between climate change and the resulting impact of severe flooding events." .. actually its hard to explain the role of changing climate given rainfall intensity data in some regions. It may be best to ignore rainfall and focus on other flood risk drivers like urbanization and intensification.

Datasets from Environment and Climate Change Canada refute the belief that rainfall is becoming more extreme.

***

The following tables show the 2 to 5 year IDF trends for 5 to 10 minutes (first table), and 5 to 10 year trends for 1 hour and 2 hours (second table)


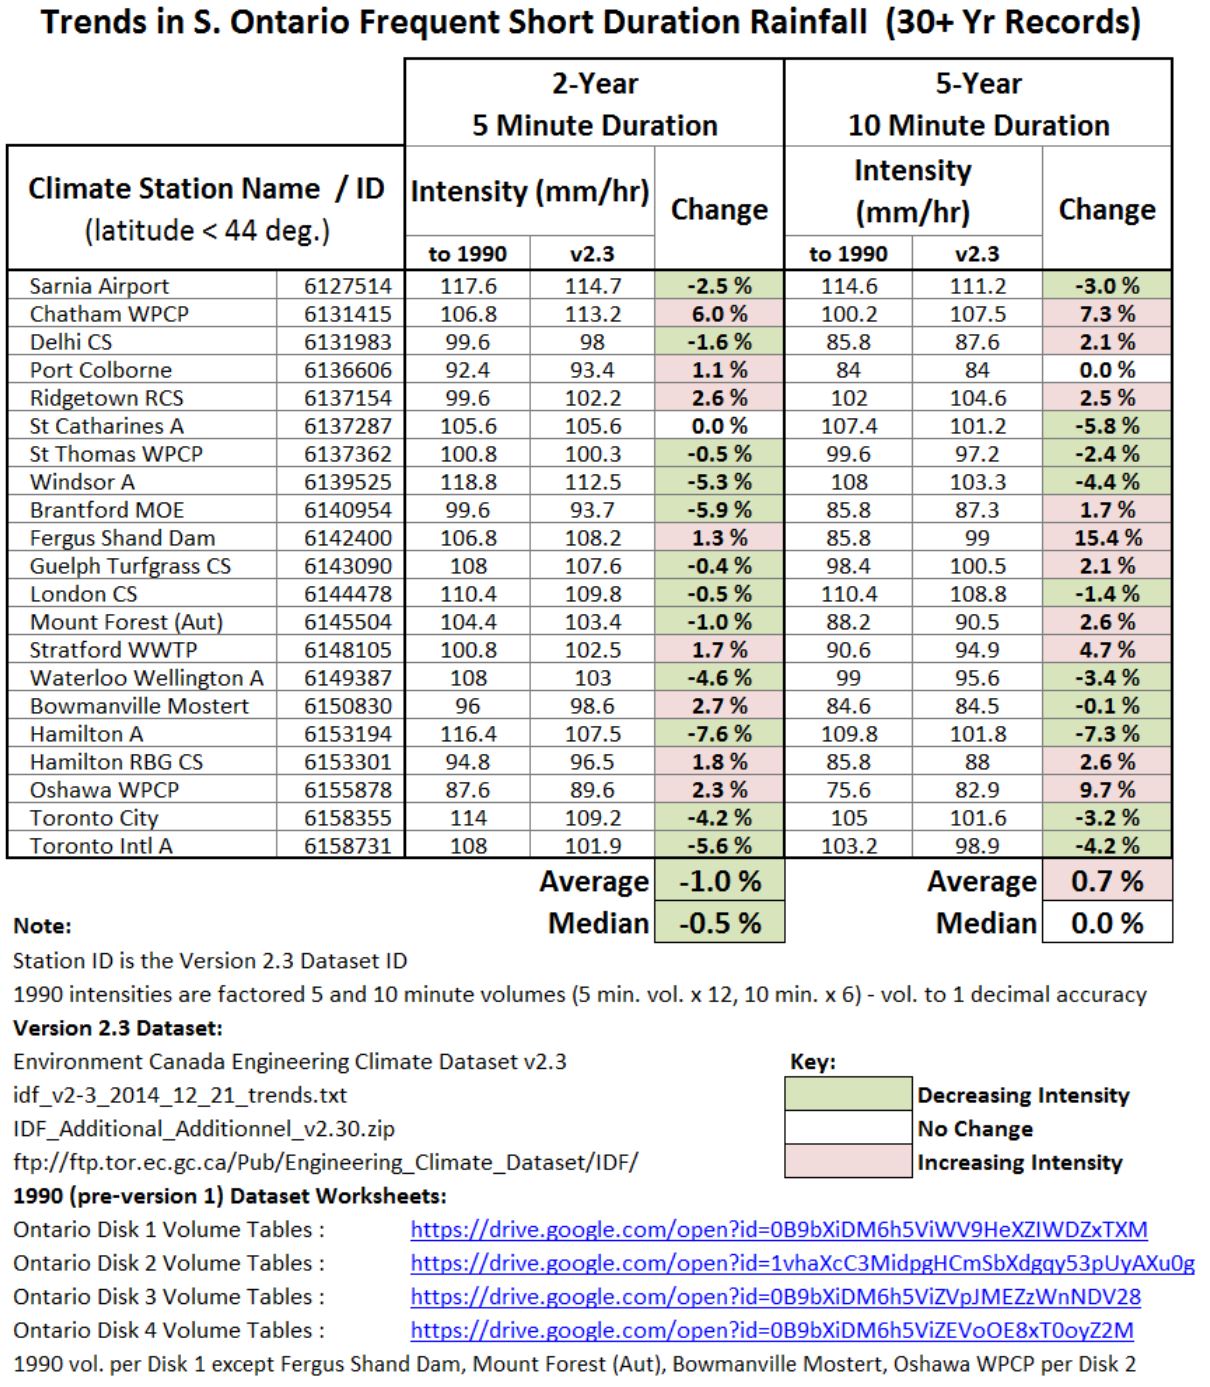
1990 (pre-version 1) IDF Dataset Worksheets have been prepared for Ontario stations:
Ontario Disk 1 Volume Tables :


https://drive.google.com/open?id=0B9bXiDM6h5ViWV9HeXZIWDZxTXM
Ontario Disk 2 Volume Tables :


https://drive.google.com/open?id=1vhaXcC3MidpgHCmSbXdgqy53pUyAXu0g
Ontario Disk 3 Volume Tables :


https://drive.google.com/open?
id=0B9bXiDM6h5ViZVpJMEZzWnNDV28
Ontario Disk 4 Volume Tables :


https://drive.google.com/open?id=0B9bXiDM6h5ViZEVoOE8xT0oyZ2M


Lost Rivers and Urban Flooding - Review of Flood Risk Factors in Toronto Wards 13 / 14 - Decreasing Extreme Rainfall Trends, Increasing Urbanization and Intensification. Financially unsustainable green infrastructure.

Toronto Wards 13 / 14 Lost Rivers Overland Flow Paths
(image can be downloaded using link at bottom of post)
The following presentation to Toronto's Green 13 group explored the role of 'lost rivers' like Ward 13/14 Wendigo Creek and Spring Creek, in driving urban flood risk. Urbanization and intensification are revealed as key factors affecting runoff rates and flood risk. Extreme rainfall trends are shown to be decreasing in Toronto and other long term Ontario climate stations, indicating no impacts due to climate change. Variations in runoff rates are shown to be explained by changes in urbanization that increase runoff coefficients in the Don River since the mid sixties, as urbanization and intensification have increased. Insurance industry claims of more frequent severe weather are shown to be disproved by Environment and Climate Change Canada's Engineering Climate Datasets.


Lost Rivers & Urban Flooding, Media, Myths & Smart Mitigation - Toronto Wards 13 / 14 - Presentation to Green 13 from Robert Muir

Toronto lost rivers (aka overland flow paths) can be explored on the following interactive map - map is (c) CityFloodMap.Com. Note, approximate TRCA regulation boundaries were estimated from camaps.ca georeferenced image features, and TRCA shoreline/slope regulation areas and some natural heritage regulation areas have been excluded to focus more on where river flood risks exist:

View larger map


The Green 13 meeting handout illustrating Toronto Ward 13 / 14 lost rivers and overland flow paths is available at the following link:  handout file