This blog has many posts that illustrate how the media, some researchers, and/or the insurance industry have missed the mark when it comes to defining past changes in extreme rainfall and the effects on communities. What is also apparent is that government agencies and ministries have also missed the mark when it comes to defining these changes and what it means to stormwater management policies and design standards.
This post provides:
1) Examples of media, researcher and insurance industry data gaps on extreme rainfall compiled over the years;
2) A presentation made to the the Ontario Ministry of the Environment, Conservation and Parks with information for Ontario (MECP) showing inaccurate government statements on past trends, and actual data characterizing southern Ontario trends to help guide development of standards for stormwater systems; and
3) References to updated material that expand on and confirm the above.
***
1) Examples of the media, researchers, and the insurance industry misstating extreme weather and rainfall trends
CBC and Radio-Canada - this blog post compiles corrections by CBC and Radio-Canada related to extreme rainfall frequency since 2015, including corrections to or the deletion of articles that violated their journalistic standards and practices, including the commitment for accuracy in reporting: https://www.cityfloodmap.com/2019/06/cbc-correcting-claims-on-extreme.html
Key take-away: even large media organizations are not well-equipped to critically report on the basics of extreme rainfall.
TVO - this blog post includes a critique of storm intensity and extreme temperature reporting in 2017 and 2019: https://www.cityfloodmap.com/2017/11/tvo-articles-on-climate-change-extreme.html
Key take-away: smaller media organizations are not well-equipped to critically report on the basics of extreme rainfall or temperature trends either.
Insurance Industry / Researchers (plus more media) - this presentation shows that many cannot tell the difference between a theoretical, arbitrary 'bell-curve' shift in extreme weather frequency and actual observations, and that there is no fact-checking in most media. This relates to the widely-reported incorrect claim in the Institute for Catastrophic Loss Reduction (ICLR) report "Telling the Weather Story" for the Insurance Bureau of Canada (IBC) that "weather events that used to happen once every 40 years are now happening once every size years": https://www.slideshare.net/RobertMuir3/storm-intensity-not-increasing-factual-review-of-engineering-datasets
Key take-away: media organizations, and even the chief economist at a large Canadian bank, do not verify suggested extreme rainfall or weather trends in Canada, and will widely echo unsupported/incorrect/false statements. In this case the insurance industry had not checked the researcher statements in a report they commissioned.
2) MECP presentation on extreme rainfall trends to guide stormwater design standards
The MECP embanked on the development of design standards for wastewater and stormwater systems in Ontario to support Consolidated Linear Infrastructure (CLI) Environmental Compliance Approvals (ECAs). CLI ECA's for stormwater systems (like wastewater systems) are intended to consolidate individual ECA's for stormwater infrastructure in a municipality.
Adapting to a changing climate is one consideration in developing stormwater management standards and criteria. New, expanded criteria have been proposed for stormwater CLI ECAs, largely echoing the MECP's draft Low Impact Development Stormwater Management Guidance Manual criteria such as managing 90th percentile storm events (see January 2022 ERO posting: https://ero.ontario.ca/notice/019-4971). The ERO posting notes several goals including:
"The draft Low Impact Development Stormwater Management Guidance Manual aims to ... Increase resiliency of communities and associated stormwater infrastructure to climate change and help mitigate climate change"
A presentation was made to the MECP Stormwater Design and Permissions Working Group on May 1, 2019 to support the stormwater CLI ECA development, providing actual data on past trends. Some highlights are below illustrating that:
i) the former Environmental Commissioner of Ontario also echoed the above incorrect/unsupported insurance industry statements on increasing extreme weather frequency:

ii) Ontario government documents claims more frequent extreme weather is 'already underway':


To provide a more complete perspective on rainfall intensity trends, Kaz Adamowski and John Bougadis also analyzed trends in Ontario rainfall intensities in 2003 in HYDROLOGICAL PROCESSES (Hydrol. Process. 17, 3547–3560 (2003)), published online in Wiley InterScience (www.interscience.wiley.com), DOI: 10.1002/hyp.1353. As shown below, that analysis found both increasing and decreasing trends - not just the increases cited by MECP.
Adamowski and Bougadis found significant increasing trends only in northern Ontario. In southern Ontario 'significant negative trends' were observed for all durations, except the 2 hour. Central Ontario had positive trends, but none were statistically significant:

The full slide presentation to MECP including the selected slides above is as follows:
Historical extreme rainfall trends in Canada and across Ontario have been summarized in the National Research Council of Canada (NRC) National Guidelines on Undertaking a Comprehensive Analysis of Benefits, Costs and Uncertainties of Storm Drainage and Flood Control Infrastructure in a Changing Climate (see post: https://www.cityfloodmap.com/2022/02/nrc-national-guidelines-on-flood.html).
The Ontario trends noted in the 2019 slides above, that included IDF data Environment and Climate Change Canada's Version 3.00 Engineering Climate Datasets, have been updated with Version 3.10 data. For example, southern Ontario annual maximum trends and IDF trends based on recent updates are shown below:
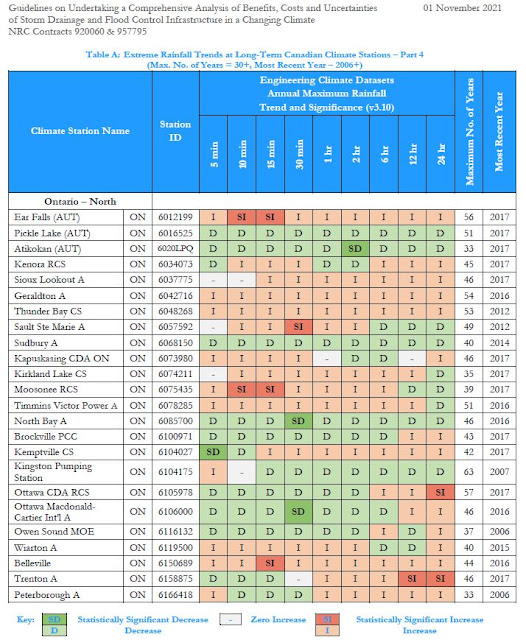

Therefore data continue to not show any 40 to 6 year frequency shift in extreme rainfall across Canada, as claimed by some researchers. Overall, extreme rainfall intensities have decreased at over 200 climate stations with available data in Canada as illustrated in the NRC guideline (see the blog post noted above for details). In southern Ontario, some intensities have decreased on average, like the 2-year rainfall intensities, consistent with Adamowski and Bourgadis' 2003 analysis noted earlier.
Stormwater management standards in Ontario, whether in a LID Manual or CLI ECA criteria, should consider the actual rainfall data trends and the resulting risks to systems. This is currently not occurring.
Consistent with past observations of extreme rainfall trends are the future projections for southern Ontario (see post: https://www.cityfloodmap.com/2022/01/future-extreme-rainfall-idf-values-in.html). In Assessment of non-stationary IDF curves under a changing climate: Case study of different climatic zones in Canada in the August 2021 Journal of Hydrology: Regional Studies, Silva et al. projected future IDF curves in several regions of Canada under various emissions. When more plausible emissions scenarios are considered (see RCP2.6 projections below), the 100-year intensities decrease in London and Hamilton:

