A previous post reviewed Environment and Climate Change Canada's Adjusted Homogenized Canadian Climate Data (AHCCD) and temperature trends in Toronto and Ottawa. See post: https://www.cityfloodmap.com/2017/11/tvo-articles-on-climate-change-extreme.html
Temperature changes have been related to extreme rainfall changes, given the higher water holding capacity of warmer air.
This post presents more trends in annual maximum daily temperature at 12 cities across Canada. The AHCCD has recently been updated in 2020 - see summary here: https://www.canada.ca/en/environment-climate-change/services/climate-change/science-research-data/climate-trends-variability/adjusted-homogenized-canadian-data/surface-air-temperature.html
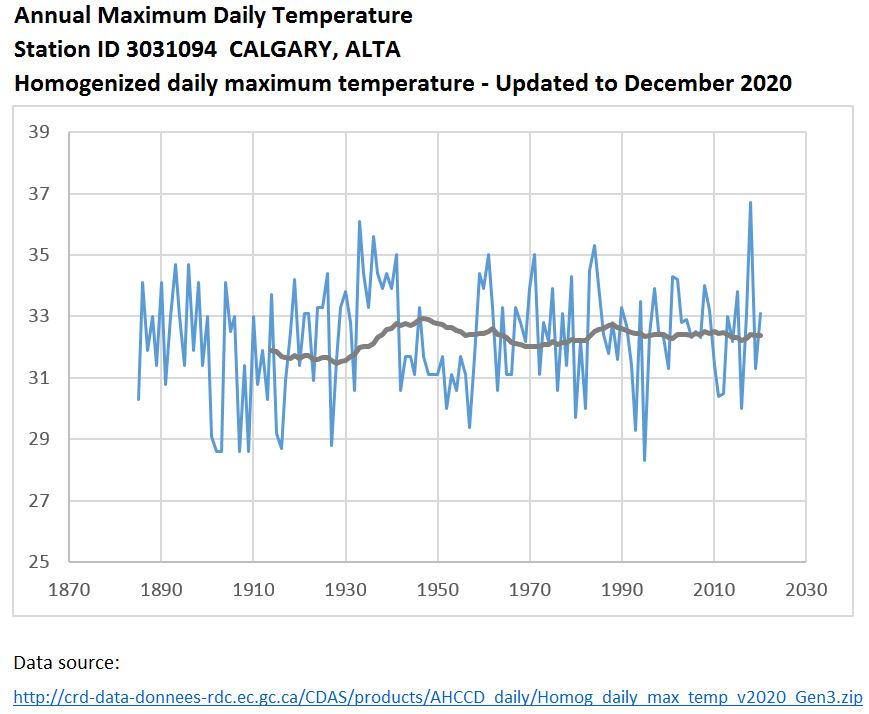
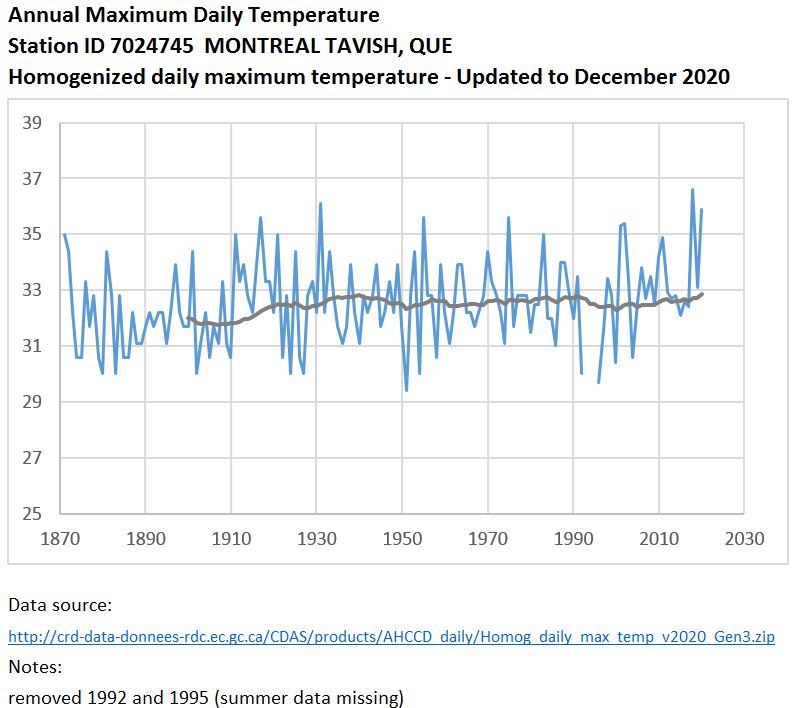
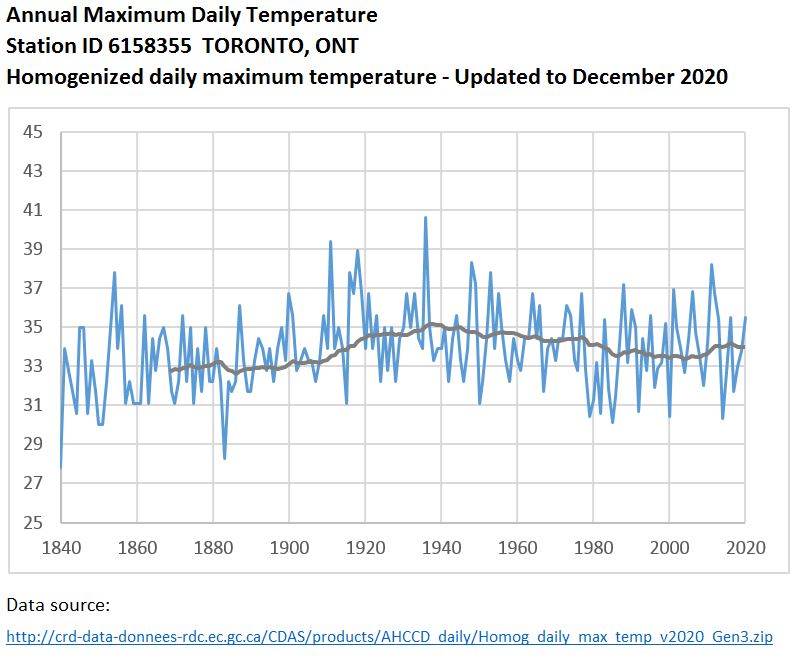
The following charts present the annual maximum temperatures (blue line) and 30-year moving average trends (grey line). Years with missing summer data have been removed. The selection of stations is based on those with long records but is not exhaustive. It is not clear if urban heat island effects could be a factor at these stations as well.
In Calgary the period up to the 1940's and 1950's was warmer (had higher maximum daily temperatures) that the most recent period:
In Chilliwack, temperatures have been fairly steady up until the periods ending in the 2000's after which some very high extremes have occurred:
In Fredericton the 30-year rolling average of maximum daily temperature has been increasing since the period ending in the 1930's, but has been decreasing since about 2000:
In Halifax, the average maximum temperatures here highest in the periods before about 1960, after which there was a drop. Since that drop the average has been increasing since 1990:
In Moncton, the average maximum temperatures have been relatively flat:
In Montreal, pre-1910 had lower daily maximum temperatures on average. Since the 1930's average maximum temperatures have been flat:
In Ottawa, the 30-year average has been decreasing since the late 1800's and early 1900's:
In Saskatoon, the 30-year average of maximum temperatures increased up to1940 and has been decreasing since then:
In St. John's, the daily maximum temperatures decreased in the late 1800's but overall have since been increasing, with a slight recent decrease:
In Vancouver, there appears to be a discontinuity in the data, with no trend up to 1930, a steep increase up to 1960, and generally flat (slightly increasing) trend since then:
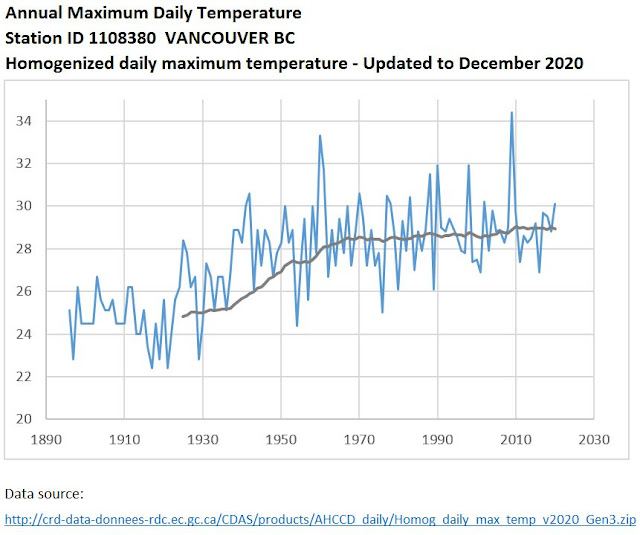
"Temperature records for Vancouver begin in 1896. Looking at the 100 years from 1918 to 2018, February and September average daytime highs rose slightly, at about 1.5 degrees per century, while the other 10 months did not exhibit a statistically significant trend. Looking at the interval from 1938 forward, no month exhibits a significant upward trend in average daytime highs, in fact four months went down slightly. Looking at 1958 to the present, four months warmed slightly, but the annual average daytime high did not exhibit a significant trend." - the chart above supports this observation with annual maximum temperatures 'flat' since the late 1930's.
In Winnipeg, average maximum temperatures have been decreasing since the period ending in about 1950:
In Toronto, the trend is similar to Winnipeg - there were increases up to the periods ending in about the mid 1930's then a decrease:
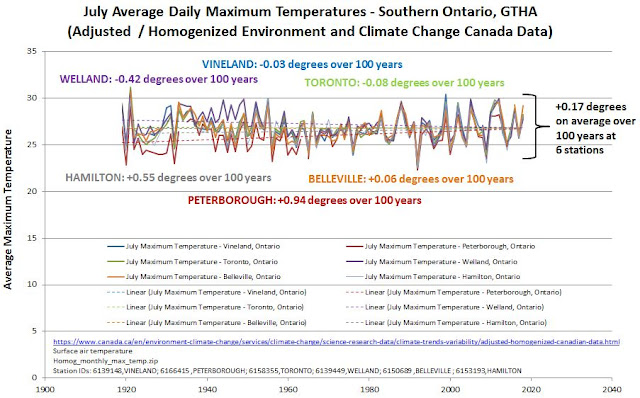
The previous post, based on data up to 2018, showed the trends in July daily maximum temperatures for other southern Ontario climate stations including Welland, Vineland, Hamlton, Belleville, Toronto and Peterborough. The trends included increases and decreases and an average increase of 0.17 degrees Celsius at these 6 stations:
Additional reading: Ross McKitrick has done a more thorough analysis of Canadian temperatures in his paper "Trends in Historical Daytime Highs in Canada 1888-2017" in 2018 (link:
https://www.rossmckitrick.com/uploads/4/8/0/8/4808045/temp_report.pdf). He noted trends across Canada similar to those for southern Ontario above, writing "Since 1939 there has been virtually no change in the median July and August daytime highs across Canada, and October has cooled slightly."
Previous posts explored whether extreme rainfall intensities have increased in Canada - recent updates in Engineering Climate Datasets show no recent increase in 100-year design intensities and longer-term trends in southern Ontario stations have not shown increases in those extremes overall. It is possible that the lack of consistent increases in extreme temperature could be related to the trends in extreme rainfall - of course the charts above are limited to annual maximum daily temperatures and not longer-period temperatures that could also be influencing design rainfall intensities.
***
How do you analyze temperature data in the AHCCD?
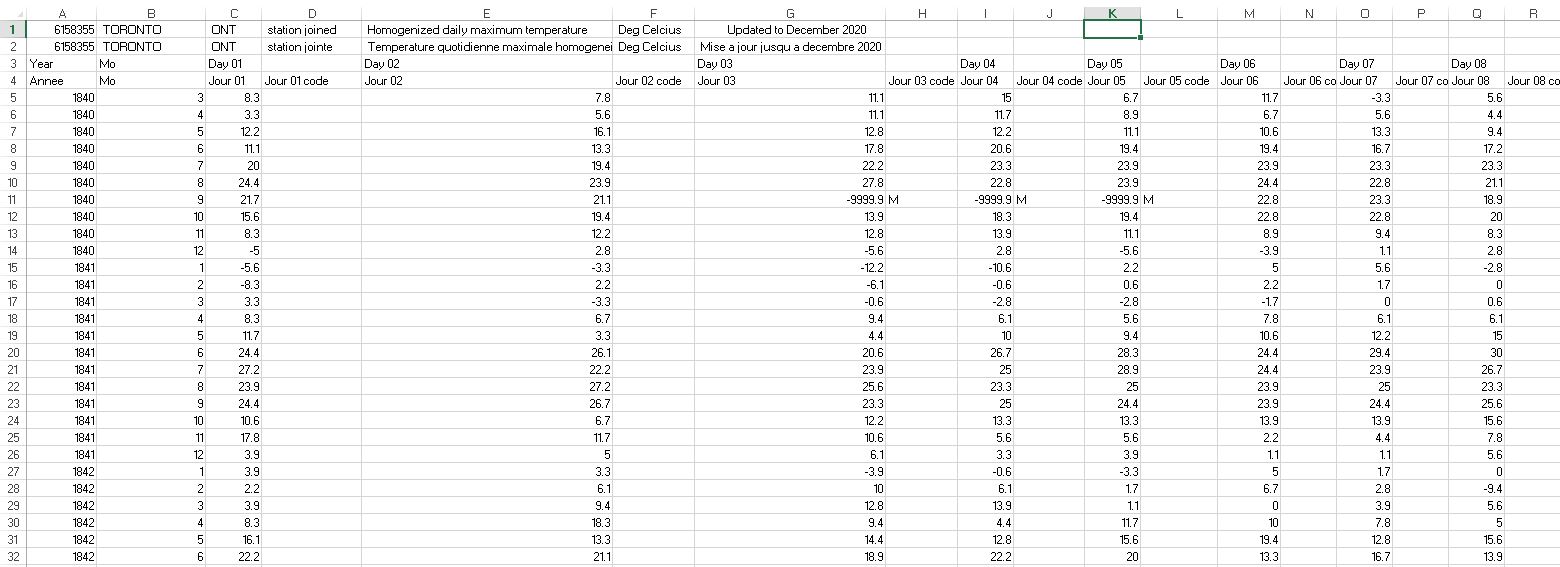
Some manipulation of the raw AHCCD information is needed to determine annual maximum temperatures and to assess the 30-year trends charted above. The AHCCD data is provided in a compressed 'zip' file that contains individual files for each location, or climate station. Individual files are text files in ASCII format and are named after the climate station ID #. For example Toronto's station ID 6158355 has a data file called dx6158355.txt that looks like this:
This data file can be imported into an MS Excel worksheet and then be parsed, converting long text strings in column A to separate columns (use Text to Column function). Parsed data, with a column title added to the "data code" column after each day's maximum daily temperature data, would look like this:
Each row of data starting on Row 5 above represents the daily maximum temperatures in a single month. The maximum temperatures for each month can be calculated in column BN using the MAX function. For example, the red text shows maximum temperatures in each month (the maximum daily temperature across the row):
To determine the maximum temperature each year, the Excel Pivot Table function can be used. After selecting the column heading Row 4 and all data rows below and Columns A to BN, insert Pivot Table on a new worksheet. In the Pivot Table Fields window, drag "Annee" (year) into the Rows box and drag "Daily_max" into the Values box. The Values field will by default assign a sum function showing "Sum of Daily_max", summing all the monthly maximum temperatures in each year - change that to a max function by clicking on the field and setting value field setting to "Max":
The result of the Pivot Table is shown below, with the maximum daily temperature determined for each year:
The annual maximum temperatures can be charted using an XY scatter plot in Excel. To create the 30-year moving average trend, insert a trendline (right click on the plotted line and select "Add a trendline"). Change the trendline type of moving average, specifying "Period" of 30 to average 30 years of annual maximum values (i.e., the overall maximum temperature climate trend for the prior 30 years).
***
Extreme heat and trends can also be characterized using other statistics besides annual maximum temperatures reviewed above. For example, the number of days over a threshold value, such as 30 degrees Celsius, and that would be associated with stresses can be used as well.
The AHCCD data assessed above can be used to count the number of days in each month reaching over a threshold temperature, and those monthly counts can be summed for each year in the record. The example charts below show the number of days in each year with maximum temperature over 30 degrees Celsius. These charts also show the 30-year moving average of number of days over 30 degrees.
In Toronto, the average number of days over 30 degrees was highest many decades ago. The dashed black line shows this average and the ECCC AHCCD data shows that in the 30 years up to 1959 there were 14.9 days above 30 degrees, while in the 30 years up to 2020 there were fewer at 14.0 days a year. In the periods up to 1938-1941 the average number of extremely hot days was also high than the recent past, with 14.4 days above 30 degrees for those earlier periods:
In Calgary, similar analysis shows that earlier periods were hottest. The 30 year average up to 2020 has an average number of days above 30 degrees of 4.8, compared to the period up to 1941 that had 6.1 days. The recent average of 4.8 days was exceeded in all the periods up to 1933 to 1955, and the periods up to 1986 to 1989 as well: