Previous posts have reviewed trends in extreme rainfall across Canada, in various regions including southern Ontario, and in the Greater Toronto Area (GTA), including Toronto and Mississauga where long-term climate data is available for review.
Projections of future extreme rainfall increases are commonly made as part of climate change studies. A review of past trends in extreme rainfall was made in the 2021 National Research Council flooding cost benefit guidelines, as summarized in a previous post. The following chart was included in those guidelines and shows the trends in 100-year daily rainfall at two GTA climate stations in downtown Toronto and at Pearson International Airport in the adjacent municipality of Mississauga.
The chart shows the 100-year rainfall depth using data records up to 1990 and then adding more recent data up to 2017. The chart shows that the 100-year rainfall at Pearson Airport/Mississauga has been decreasing slightly when recent data is added after 1990. Meanwhile the Toronto rainfall has been increasing slightly (see dotted and dashed black lines on the chart above for the trends).
Several climate studies have projected that the 100-year daily rainfall would increase over coming decades as shown on the chart. The Toronto's Future Weather & Climate Driver Study by SENES projected a doubling of this rainfall statistic by 2040-2049, relative to a 2000-2009 baseline value (see the orange dashed line on the chart above, where the 2000-2009 value is shown at 2005 and the 2040-2049 value is shown at 2045).
Some additional data has been analyzed by Environment and Climate Change Canada for the Toronto climate station, now including data up to 2021. This allows the 100-year daily rainfall statistic to be updated with a few more years of data. The chart below shows the additional Toronto data point circled in yellow at 2021.
While the Toronto rainfall statistic up to 2017 was 97.5 mm, the value up to 2021 decreased slightly to 97.3 mm. The value up to 2017 reflected the prior July 8, 2013 extreme event, creating a jump after 2007 when the value was slightly lower at 94.7 mm. As more data is observed below the 2013 extreme, the statistic should continue to decrease as more data is added and analyzed.
The take-away? Observational data, including data up to 2021, does not support the projected significant increases in 100-year daily rain in climate studies. The Toronto data is available over the period of 1940 to 2021.
How far off are the projected increases in extreme rainfall? The Toronto Future Weather & Climate study projected a theoretical 31mm/decade increase over 40 years - that was for Pearson Airport climate station. Actual data at Pearson Airport shows an observed increase of only 3.1mm/decade. This considers a value of 115.1 mm in the middle of the 1950-2003 period and a value of 125.5 mm for 2003-2017 - that later value is estimated to generate the current value of 117.3 mm by using a weighted average across all years from 1950 to 2017. For Toronto the actual increase is only 2.0 mm/decade.
On average the GTA (Toronto and Pearson/Mississauga) increase is about 2.5 mm/decade, or less than a tenth of almost 31mm/decade projected in the SENES climate/future weather study.
***
Further reading in previous posts on extreme rainfall trends:
1) Rainfall intensity trends in Canada:
a) 226 long term climate stations in the Engineering Climate Dataset are used to show actual trends between rain intensity statistics up to 2007 and then up to 2017: https://www.cityfloodmap.com/2020/12/design-rainfall-trends-in-canada.html
b) more of the above plus observed annual maxima rainfall trends as reported in the 2021 National Research Council of Canada (NRC) "National Guidelines on Undertaking a Comprehensive Analysis of Benefits, Costs and Uncertainties of Storm Drainage and Flood Control Infrastructure in a Changing Climate": https://www.cityfloodmap.com/2022/02/nrc-national-guidelines-on-flood.html
2) Rainfall intensity trends in Southern Ontario:
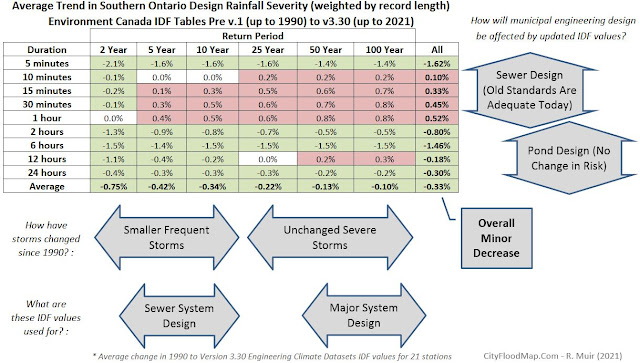
a) ECCC's Engineering Climate Dataset Intensity Duration Frequency (IDF) trends for long-term southern Ontario climate stations, comparing statistics up to 1990 and current values (v3.3 datasets with some station data up to 2021): https://www.cityfloodmap.com/2023/05/southern-ontario-extreme-rainfall.html
3) Rainfall extreme reporting (?) in the media (including Toronto, Mississauga trend review):
a) Thinking Fast and Slow About Extreme Weather and Climate Change, inspired by the late Daniel Kahneman (RIP good sir), exploring the cognitive biases in extreme rainfall reporting in the media: https://www.cityfloodmap.com/2015/11/thinking-fast-and-slow-about-extreme.html
b) my paper with "Thinking Fast and Slow" themes published in the Journal of Water Management Modelling with the title "Evidence Based Policy Gaps in Water Resources: Thinking Fast and Slow on Floods and Flow": https://www.chijournal.org/C449


