See the latest at the end of this post (Jan. 2021). The CBC has done a great job in correcting its reporting of extreme weather frequency claims over the years. Other media organizations like TVO and major newspapers have been given the same feedback on inaccurate reporting as CBC but have not moved to correct exaggerated claims. But while CBC has made may corrections, both voluntarily by its journalists and through the coaxing of its Radio-Canada Ombudsman, it has a tendency to repeat past inaccuracies without benefiting from what it has learned - so there is an opportunity to have the CBC be more consistent in its reporting, even adhering better to its own standards.
What are some examples of CBC's past corrections on extreme weather trends? Here are those that I helped move along.
1) November 2015
The CBC has corrected articles on this topic in the past as well dating back to 2015, confirming that there have been no changes in extreme rainfall. This correction was in response to a statement made by the insurance industry when an insurance broker stated we are having 20 times more storms today. This blog post describes the statement ""A lot of it has to do with the frequency of the storms and I think you could even extrapolate that it's got to do with climate change," ... "we're getting 20 times more storms now than we were 20 years ago." Here is a write-up on that exchange
https://www.cityfloodmap.com/2015/10/bogus-statements-on-storms-in-cbcnewsca.html
CBC issued a correction and wrote me a letter dated Nov. 20 2015 (see excerpt in blog post link above and at right) saying "Environment Canada verified that there has been no significant change in rainfall events over several decades". In the article (link:
https://www.cbc.ca/news/canada/windsor/more-than-half-of-homeowners-insurance-claims-stem-from-water-damage-broker-says-1.3291111) the correction is as follows:
"
However, Environment Canada says it has recently looked at the trends in heavy rainfall events and there were "no significant changes" in the Windsor region between 1953 and 2012."

– this finding from 2015 is
still valid today - a review of the updated Engineering Climate Datasets v3.0 released in March 2019 shows that across all of southern Ontario in fact observed rainfall intensities have been decreasing as engineering design “IDF” values have been decreasing as a result – this is shown for small frequency storms and large rare storms as well (see
previous post on IDF trends, see
previous post on decreasing annual maximum rainfall trends, see Stantec's review of Windsor Airport extreme rain trends in the December 2018 Windsor/Essex Region
noted in this blog post and in the excerpt to the right - see "
Conclusion: Short-term durations events are slightly trending downwards thus no evidence to increasing IDF curves for stormwater design").
2) January 2019
The recent CBC Ombudsman ruling [January 28, 2019] disputes statements made by Dr. Blair Feltmate of the Intact Centre on Climate Adaptation on the frequency of storms linked to flooding (100 Year storms).
See link to decision in English:
https://drive.google.com/open?id=1o9nUurzw_SkONJTbdEEp9OysNjCVtLxa
Link to the decision in French:
https://cbc.radio-canada.ca/fr/ombudsman/revisions/2019-01-28
This was in response to a story by CBC's Marc Montgomery that has been corrected:
https://www.rcinet.ca/en/2019/01/30/how-to-mitigate-the-effects-and-flood-damage-from-climate-change/
And corrections to a counterpoint story where I was interviewed by Marc Montgomery and where I had brought up concerns with the accuracy of the initial story:
https://www.rcinet.ca/en/2019/01/30/response-to-a-climate-change-story/
CBC originally stated “We are experiencing storms of greater magnitude, more volume of rain coming down over short periods of time these days due to climate change. That is causing massive flooding.” However the CBC Ombudsman concludes that:
"
One only had to examine the official Environment Canada data for Ontario as well as for the entire country to acknowledge that the claim made in the article was inaccurate. Such acknowledgement would at the same time have addressed the complainant’s criticism regarding the lack of data to corroborate Dr. Feltmate’s claim about the increased frequency of extreme rainfall events in Canada."
The Ombudsman also found that the CBC did not meet its own standards for accuracy and impartiality stating:
"Review by the Office of the Ombudsman, French Services, CBC/Radio-Canada of two complaints asserting that the articles by journalist Marc Montgomery entitled How to mitigate the effects of flood damage from climate change and Response to a climate change story, posted on September 19 and November 19, 2018, respectively by Radio Canada international (RCI), failed to comply with the CBC/Radio-Canada Journalistic Standards and Practices regarding accuracy and impartiality."
3) April 2019
The CBC corrected this article entitled "Canada warming at twice the global rate, leaked report finds"
https://www.cbc.ca/news/technology/canada-warming-at-twice-the-global-rate-leaked-report-finds-1.5079765 in April 2019. The article referenced Environment and Climate Change Canada’s (ECCC’s) Canada’s Changing Climate report
https://changingclimate.ca/CCCR2019/ that reviewed extreme precipitation trends in Canada and stated:
"
There do not appear to be detectable trends in short-duration extreme rainfall in Canada ..." and "For Canada as a whole, there is a lack of observational evidence of changes in daily and short-duration extreme precipitation.”
The original article linked current flooding to changes in rainfall stating "Although flooding is often the result of many factors, more intense rainfall will increase urban flood risks."
I highlighted sections of the ECCC report stating lack of evidence of changes in rainfall extremes and as a result, this is the correction CBC made in response:
"
Corrections, An earlier version of this story said that more intense rainfall contributes to increased urban flooding. In fact, while the report states that precipitation is higher overall, it did not find that episodes of short-duration extreme rainfall have increased or establish a connection between these and increased or exacerbated flooding. Apr 04, 2019 2:23 PM ET"
4) May 2019
In a April 11, 2019 CBC News article by Chris Arsenault entitled "“Canada's building code is getting a climate change rewrite. Is your home ready?” made the statement in the sub-headline “Increased flooding, wildfires and storms mean tough new rules take effect in 2025” which mischaracterizes trends in storms and flooding.
I shared the Ombudsman findings from January 2019, and CBC's earlier corrections on extreme rain trends. I also shared information on key causes of flooding, highlighting urbanization as a key factor per IPCC reporting, ECCC's Canada's changing climate report, local university studies and Ontario case law.
In response to this feedback CBC corrected the April 11, 2019 CBC News article per Paul Hambleton’s email to me on May 16, 2019. In response to the actual data showing no historical trends in extreme rainfall, CBC revised the sub-headline from “Increased flooding, wildfires and storms mean tough new rules take effect in 2025” to “Predicted increase in flooding, wildfires and storms means tough new rules take effect in 2025”.
This is now accurate - there have been no changes to date but there are predicted changes in the future. Canada's Minister of Environment and Climate Change Catherine McKenna has confirmed the lack of observed changes in extreme precipitation in a June 13, 2019 letter to me (see right).
In the letter she reiterates a statement made in Canada's Changing Climate Report stating: "the observational record has not yet shown evidence of consistent changes in short-duration precipitation extremes across the country" - The original report stated more simply (page 117):
"For Canada as a whole, observational evidence of changes in extreme precipitation amounts, accumulated over periods of a day or less, is lacking."
So bravo for CBC for making corrections to its reporting on extreme weather trends! No other media outlet has been receptive to making corrections based on feedback. CBC's original corrections in 2015 are supported by new local and region data, and the recent corrections are supported by Minister McKenna's recent statement and Environment and Climate Change Canada reporting.
4) September 2019
The CBC Ombudsman Jack Nagler has reviewed the April 11, 2019 CBC News article regarding reported flood damages. The Ombudsman's review is here entitled
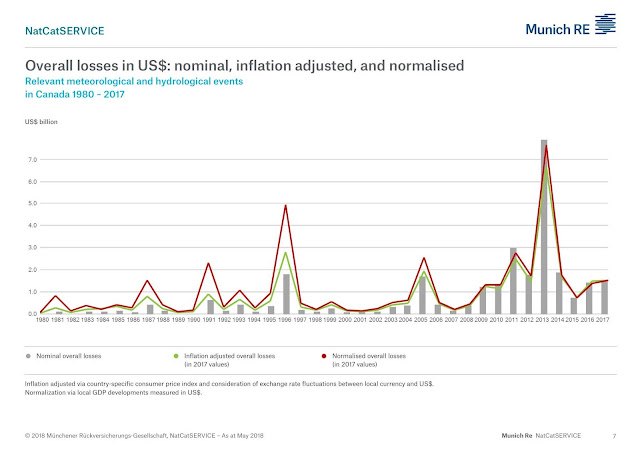
"Assessing the Damage". It found that while there is uncertainty in how flood damages are estimated, considering direct and indirect costs (we agree), the article cited flood event costs that were plain "wrong" - the costs for a Toronto August 2018 flood event, supplied by the Intact Centre on Climate Adaptation, did not represent that event at all and related somehow to the July 8, 2013 event. The review reads:
"The $43,000 figure did not represent the Intact Centre’s estimate for the 2018 Toronto storm, but instead was their estimate for the 2013 Toronto storm"
The Ombudsman found a couple violations of CBC practices:
i) The wrong damage value for the August 2018 Toronto storm/flood
ii) Failing to document earlier corrections to the story (see point 3 above on those)
A key take away is this (my bold):
"I have a broader concern that
there is a pattern of imprecision in CBC’s coverage relating to flood events. You provided me with a list of other recent CBC stories which make reference to the $43,000 damage estimate. Several confuse the matter by not indicating this is a specific estimate for the 2013 Toronto floods. One said, “The average basement flood in Ontario costs the homeowner $43,000.” Another said, “The average payout for a flooded basement is $43,000 and rising.”
These types of references take a single (and unusual) event in 2013 and treat it as if it is now a generic standard.
Reporters and editors need to ensure they understand what's included (and what's not) in any estimates provided, and they need to ensure that they associate that estimate with the correct event - or events, as the case may be. Based on my review,
that is not happening consistently enough."
Me too on that broader concern.
***
Recent CBC coverage seems to go back and repeat the same inaccurate statements that have been made in the past and that have been corrected. Especially for extreme weather trends and their effect to flooding. Perhaps CBC needs to promote what it has already found on the topic of extreme weather trends and that could help it carry forward with more accurate reporting in the future?
Perhaps Ombudsman Jack Nagler's observation on the "pattern of imprecision", resulting in treating unusual events as standards (averages), will help improve CBC reporting related to flood events.
R. Muir
***
5) January 2021
NEW! : see Radio Canada's harsh new review of June 2020 reporting on extreme rainfall trends:
Similar to the review in January 2019 described above, the Ombudsman has found additional violations of the broadcaster's JSP on the same topic by the same journalist - this has now resulted in Radio Canada management deleting the story that mistakenly 'confirmed' that extreme rainfall is more severe.