University of Guelph Research Shows Lower Spring Flooding With Global Warming, No Change in Rainfall, and Explains Urban Flooding Due to Urbanization - Not Climate Change Effects

Research from the University of Guelph has shown that climate change has reduced spring flooding risk (exponential growth in frost-free days with more recharge and less snow pack / spring melt) and that summer flow changes are due to urbanization, not changes in precipitation.

The presentation below summarizes the research and is entitled "Disentangling Impacts of Climate & Land Use Change on Quantity & Quality of River Flows in Southern Ontario" - the authors, Trevor Dickinson and Ramesh Rudra from the University of Guelph clearly see the need to clarify drivers for flow changes and to avoid the common media mistake of associating all extreme hydrologic conditions with climate change and omitting changes that may lower risks (like spring flooding in some watersheds).


Research indicates:
1) Monthly and Annual Precipitation has remained unchanged (see slide 7)
2) Temperatures have risen 'mostly in the winter' (see slide 13 - 14), meaning summer maximum temperatures that are typically associated with extreme rainfall have not increased, or have decreased
3) Extreme daily maximum temperatures have decreased (slide 14)
4) Increased winter temperatures mean more steady winter runoff, more infiltration and "Decreased Snowmelt Floods" (see slides 24 - 31)
5) Urbanization increases runoff coefficients (slide 36-37) and:

" So … in Ontario urban watersheds: - urban development has augmented the winter and spring climate change impacts; and - summer flow volumes have increased dramatically, in volume and frequency, these impacts being completely due to urban development."

The big take away is that urbanization is a key driver for summer river flows in Southern Ontario, but climate change is not - this is supported by trends in the Engineering Climate Datasets (version 2.3) that show twice as many statistically significant decreasing Southern Ontario trends as increasing ones.

This analysis is consistent with review by others showing change in minimum temperatures but no change in summer maximum temperatures. For example, the Ontario Centre for Climate Impacts and Adaptation Resources reviewed climate change trends for several stations - for Ottawa airport, between 1939 and 2014, the average winter minimum is up by 2.5 degrees Celcius and average winter mean is up 2.2 degrees. But the summer maximum is flat - no change. While the summer mean temperature is up by 0.5 degrees, this is due to increases in minimum temperatures, which were up by 1.1 degrees. These graphs from the Centre show the difference in winter temperatures changes and summer temperatures changes:

Winter temperatures have increased with climate change - Ottawa, 1939-2016

Summer maximum temperatures (middle chart) have NOT increased with climate change - Ottawa, 1939-2016. Changes in mean temperature are driven by changes in minimum temperatures.
Those who point to the Clausius-Clapeyron equation and a greater water vapour holding capacity at higher temperatures as a driver for climate change-induced flooding in urban areas should reevaluate their position, and consider the data on maximum temperatures. Since there is no increase in summer maximum temperature at some stations, the cause of flooding due to extreme rainfall cannot be greater water vapour holding capacity of the air - as research at the University of Guelph has shown, urbanization and not climate change is the key driver for changes in river flow. We can expect the same types of flow impacts beyond river systems and within municipal infrastructure systems, where urbanization and intensification have increases hydrologic stresses on systems even with no change to rainfall inputs.

The Ontario Centre for Climate Impacts and Adaptation Resources reviewed climate change trends for Hamilton as well. The following charts show the same relative temperatures changes as Ottawa:
Hamilton winter temperature has increased the most due to climate change.

Hamilton summer temperatures have increased at only a fraction of the winter increase.
 The Hamilton summer maximum temperatures increase (0.4 degrees in 40 years from 1970 to 2010) is only a fraction of the winter maximum increase (1.8 degrees in 40 years). The 0.4 degree increase in summer maximum would translate into less than a 3% change in water vapour holding capacity over 40 years. A review of research in another post has shown that temperature increases have not resulted in extreme rainfall increases across Canada - see post here.

Urbanization has increased significantly in Southern Ontario since the mid 1960's as shown in this post - this includes Hamilton growth:


In the Toronto area, where the University of Guelph assessed changes in runoff and linked these to urbanization as opposed to climate change, growth has also been significant since the mid 1960's. The following table shows changes in Toronto-area watersheds where urbanization increased from 59% to 986% over a perido of about 35 years. Compared to theoretical temperature-induced water vapour changes changes of a few percentage, if any at all, urbanization clearly explains higher runoff stress and flood risk while climate change explains none of the risks.

Urban Growth in TRCA watersheds and Flood Risk Influence on Urban Flooding

Greater Toronto Area Urban Area Growth in TRCA watersheds and Flood Risk Influence on Urban Flooding

Climate Change and Infrastructure Resiliency Assessment - What Representative Concentration Pathways Should be Used to Estimate Future IDF Curves? Caution Using RCP8.5.

There is considerable uncertainty in modern infrastructure design methods when rainfall design intensities are well established using past observations and derived return period values. The uncertainties include:

1) runoff coefficients or other hydrology parameters, especially for pervious surfaces
2) catchment response time (time of concentration), typically estimated using empirical methods
3) rainfall temporal pattern, aka design storm hyetograph, derived from input IDF data (for hydrologic and hydraulic simulations) ... and the spatial pattern which is always ignored because it is chaos
4) hydraulic performance of inlets and grates
5) hydraulic roughness and energy losses in junctions, etc.

Considering future climate scenarios, the input IDF is also uncertain. Estimated future values often depend on the assumed Representative Concentration Pathway (RCP) which are called 2.6, 4.5, 6.0 and 8.5 and which represent progressively more extreme emissions, CO2 concentrations, and energy entering the troposphere (the number 2.6 represents the energy per area warming the planet you could say).

Future design IDF estimation tools like the University of Western IDF_CC Tool give a choice of 3 pathways - 2.6, 4.5 and 8.5. The description of RCP 8.5 indicates that this scenario gives the most severe climate change impacts as noted below. But the extreme intensities do not always support that statement.


The following future IDF intensity tables for RCP2.6, RCP4.5 and RCP8.5 show that the RCP4.5 scenario can give the highest short duration intensities that affect infrastructure capacity and resilience. The 5-year 5-minute intensity is highest for RCP8.5 but only 3.5% above RCP4.5, which is very small in the context of infrastructure design. But the 100-year 5-minute intensity for RCP8.5 is below the RCP4.5 values by over 8% - and the 24-hour intensity is also about 8% lower. So RCP8.5 is not the most conservative, 'most severe' scenario for extreme 100-year events. Note these tables are based on a period of 2050-2100.


The reasonableness of the RCP8.5 has been questioned. In Energy, University of British Columbia note “RCP8.5 no longer offers a trajectory of 21st-century climate change with physically relevant information for continued emphasis in scientific studies or policy assessments.” Researchers add:

"This paper finds climate change scenarios anticipate a transition toward coal because of systematic errors in fossil production outlooks based on total geologic assessments like the LBE model. Such blind spots have distorted uncertainty ranges for long-run primary energy since the 1970s and continue to influence the levels of future climate change selected for the SSP-RCP scenario framework. Accounting for this bias indicates RCP8.5 and other ‘business-as-usual scenarios’ consistent with high CO2 forcing from vast future coal combustion are exceptionally unlikely. Therefore, SSP5-RCP8.5 should not be a priority for future scientific research or a benchmark for policy studies."

Because there is such as wide range of future IDF possibilities already, it is good to know that RCP8.5 could be discounted as implausible in sensitivity analysis. The chart below shows various projections for 5-minute 100-year rainfall intensity for a range of RCP scenarios. Dropping RCP8.5 from further consideration will help focus assessments of infrastructure resiliency. But considering RCP4.5 may yield even higher IDF values than the assumed 'most severe' RCP8.5 scenario.

IDF climate change Ontario Canada
Future IDF Uncertainty - Moving Target Under Various Representative Concentration Pathways

RCP2.6 scenarios may not result in future IDF intensities that are above current design standard values as shown in the chart above.

TVO Articles on Climate Change, Extreme Rainfall and Urban Flooding Omit Basic Fact Checking and Ignore Fundamental Engineering Principles

I have posted comments on three TVO Articles on the topic of climate change, extreme weather, urban flooding and resiliency of Ontario Cities. Readers of this blog will be familiar with the content. It gets a bit repetitive from article to article, only because the data gaps are the same old ones we always see on these topics.  BONUS: a recent TVO broadcast is reviewed at the end of this post.

1) How climate change is making storms more intense, Published on Apr 21, 2017 by Tim Alamenciak

https://tvo.org/article/current-affairs/climate-watch/-how-climate-change-is-making-storms-more-intense

My Comments:
This is absolutely incorrect. Environment and Climate Change Canada (ECCC) published in Atmosphere-Ocean in 2014 that there is "no detectable trend signal" in the Engineering Climate Datasets related to short-duration rainfall that causes urban flooding:


Windsor has the lowest level of service for floodplain protection (100 year storm) while other regions have Hurricane Hazel (over 500 year storm) - so Windsor / Essex region will flood a lot more that other places. Also Windsor has been effectively tightening up their sanitary sewers to prevent spills to the river (reduced combined sewer overflows (CSOs)) which means more stays in the sewers and can back-up basements in extreme weather. Its a tough trade-off when environmental protection (keeping sewage out of the river) means more sewage in basements.

This is a recent summary of ECCC data as well as studies my Ontario universities and major engineering consultants saying decreases in extreme rainfall in Ontario. In fact there are twice as many statistically significant decreasing trends as increasing ones in southern Ontario (per the version 2.3 Engineering Climate Datasets - links to ECCC data files are all provided on the slides:


This presentation to the Ontario Waterworks Association and Water Environment Association of Ontario's Joint Climate Change Committee does extensive myth-busting related to extreme rainfall and flooding and explore the true drivers to increased flood events (spoiler-alert: its engineering hydrology and hydraulics, not meteorology). It also shows how the Clausius-Clapeyron relationship (theory relating temperature to extreme rainfall) has been disproved by research at MIT, Columbia and the University of Western. Unfortunately, there are lot of opinions and high level statements that are made without data. This is a pervasive problem in the media. When fact checking does occur, Advertising Standards Canada, the CBC Ombudsman and Canadian Underwriters have all agreed that there is no change to extreme rainfall. Here are some examples of that:

More data / facts / details:

Windsor decreasing extreme rainfall trends (Engineering Climate Datasets version 2.3 Station ID 6139525) - decreasing for ALL storm durations, and statistically significant decreases for durations of 10 minutes, 2 hours, 6 hours and 12 hours:


CBC Ombudsman confirms with ECCC, and disputes insurance industry statements that we have more storms (see letter to me):

http://www.cityfloodmap.com/2015/10/bogus-statements-on-storms-in-cbcnewsca.html

That was in response to this story that had no fact-checking:


And which had this correction made based on ECCC and real data: "However, Environment Canada says it has recently looked at the trends in heavy rainfall events and there were "no significant changes" in the Windsor region between 1953 and 2012." Canadian Underwriter editors dispute insurance industry statement on more frequent / severe storms after fact-checking with ECCC:


"Associate Editor’s Note: In the 2012 report Telling the Weather Story, commissioned to the Institute for Catastrophic Loss Reduction by the Insurance Bureau of Canada, Professor Gordon McBean writes: “Weather events that used to happen once every 40 years are now happening once every six years in some regions in the country.” A footnote cites “Environment Canada: Intensity-Duration-Frequency Tables and Graphs.” However, a spokesperson for Environment and Climate Change Canada told Canadian Underwriter that ECCC’s studies “have not shown evidence to support” this statement."

We can explain most increased flooding by hydrological changes over the past 100 years (same rain a before but more runoff than before as urban areas have expanded drastically across GTA watersheds over the past 60 years):

http://www.cityfloodmap.com/2016/08/urbanization-and-runoff-explain.html

... and specifically here is are the changes in hydrology in southern Ontario cities including the Windsor area:


We can also explain increased flooding with hydraulics related to municipal drainage design (tanks to hold back water and protect beaches can back up into basements like in my Toronto "Area 32" engineering flood study report), and related to overland flow in 'lost rivers' that statistically explain the highest concentrations of reported basement flooding:


Basically, hydrologic stresses have increases (more runoff) and conveyance capacity has decreased (reduced CSO relief, tanks to protect beaches, blocked overland flow paths in old 'lost rivers'). Underpinned/excavated basements are now lower than before, closer to the crown of the sewer pipes in the street and more prone to sewage back-ups than before, with no change in rainfall extremes due to climate change.

Robert J. Muir, M.A.Sc., P.Eng.

Toronto


2) How climate change is already costing you money, Published on Nov 01, 2017 by Patrick Metzger

https://tvo.org/article/current-affairs/climate-watch/how-climate-change-is-already-costing-you-money

My Comments:

There are many false statements in this article and a lack of basic science, statistics or critical engineering considerations. I am a licensed Professional Engineer with extensive experience in extreme weather statistics and municipal infrastructure planning and design (26 years) - this article is like 100's of others, skimming the surface and missing the critical data and conclusions, reinforcing stale pundit talking points in the climate-change-echo-chamber. Please see below for what is wrong with the article.

Firstly, the article conflates climate and weather which have different temporal scales. Climate includes rainfall and precipitation over seasons, years and decades while weather related to flooding in urban areas involves rainfall over minutes and hours. So the cited increase in precipitation is irrelevant to urban flooding and insurance since precipitation trends over months and years do not govern the performance of infrastructure systems (storm sewers, sanitary sewers, drainage channels and overland flow paths) - that infrastructure is governed by extreme rainfall rates over minutes and hours. It is an undeniable engineering fact. And these short duration rainfall intensities are 'flat' across Canada according to Environment and Climate Change Canada, as published in Atmosphere-Ocean in 2014 - in fact ECCC stated that some regions have decreasing trends including the St Lawrence basin in Quebec and the Maritimes.

My own fact checking of the Engineering Climate Datasets (version 2.3 on the ECCC ftp site) shows twice as many statistically significant decreases in southern Ontario as increases, and for the critical shortest durations, no statistically significant increases at all. Here is a review of the typical insurance industry statements and the real data:


Over the past two weeks I have correspondence from 3 scientists at ECCC stating that the annual precipitation statistic (climate) is irrelevant to urban flooding and the short duration rainfall (extreme weather) is what we should be looking at - across Canada the relevant data shows 'no detectable trend signal'. TVO should check the background of those providing information for these articles to see if the academic and practical experience aligned with the technical topic being discussed.

It is too easy to just try and may headlines and exercise 'availability bias', 'anchoring bias' and other problem-solving short cuts with discussing extreme weather and flooding. It is more responsible to look at real data and fact-check articles because there is important public policy on climate adaptation and mitigation that relies on the proper characterization of the problems that we are solving. Blaming flooding on rainfall trends misdirects resources to mitigation when it should be focused on adaptation to yesterday's extremes (due to intrinsic design limitations in 50-100 year old infrastructure and land use planning). Chief economists at major banks have repeated IBC statements on extreme weather shifts with no fact checking whatsoever - the Sun, the Star, CBC and individual insurance companies have repeated it too without checking. They have been fact checking with ECCC recently though and the consensus is that there is no shift in extreme rainfall and IBC mixed up a theoretical future shift (of an arbitrary 'bell curve' no less) and had reported it extensively as a past observation by ECCC. ECCC has denied that their data shows any increase in severe weather with climate change.

Some examples of ECCC refuting insurance industry claims:

Ombudsman confirms with ECCC, and disputes insurance industry statements that we have more storms (see letter to me):


That was in response to this story that had no fact-checking:

http://www.cbc.ca/news/canada/windsor/more-than-half-of-homeowners-insurance-claims-stem-from-water-damage-broker-says-1.3291111

And which had this correction made based on ECCC and real data: "However, Environment Canada says it has recently looked at the trends in heavy rainfall events and there were "no significant changes" in the Windsor region between 1953 and 2012."

Canadian Underwriter editors dispute insurance industry statement on more frequent / severe storms after fact-checking with ECCC:


"Associate Editor’s Note: In the 2012 report Telling the Weather Story, commissioned to the Institute for Catastrophic Loss Reduction by the Insurance Bureau of Canada, Professor Gordon McBean writes: “Weather events that used to happen once every 40 years are now happening once every six years in some regions in the country.” A footnote cites “Environment Canada: Intensity-Duration-Frequency Tables and Graphs.” However, a spokesperson for Environment and Climate Change Canada told Canadian Underwriter that ECCC’s studies “have not shown evidence to support” this statement."

Lastly, the Clausius-Clapeyron relationship linking temperature to extreme rainfall have been shown to not hold up based on real observed data. This is a review of those findings in studies from MIT, Columbia and University of Western (in London and Moncton trends are flat, while in Vancouver there is less extreme rainfall at higher temperatures):


Its time for a lot more basic fact checking on climate change, extreme weather and flooding. There is too much 'thinking fast' and not enough 'thinking slow', as shown in this review of media reporting biases through the lens of Kahneman:

http://www.cityfloodmap.com/2015/11/thinking-fast-and-slow-about-extreme.html

Unfortunately, as Kahneman puts it ""People are not accustomed to thinking hard, and are often content to trust a plausible judgment that comes to mind.", American Economic Review 93 (5) December 2003, p. 1450

"Only the small secrets need to be protected. The big ones are kept secret by public incredulity."(attributed to Marshall McLuhan) .. .so true, especially when we rely on infographics and slogans and ignore basic data in our reporting.

Robert J. Muir, M.A.Sc., P.Eng.
Toronto


3) How Ontario cities battle climate change, Published on Dec 01, 2015 by Daniel Kitts

https://tvo.org/article/current-affairs/the-next-ontario/how-ontario-cities-battle-climate-change

My Comments:

Mr Adams is correct is questioning Mr Kitts 'facts'. Because the official national Engineering Climate Datasets show no detectable trend in extreme rainfall in Canada. This was published in Atmosphere-Ocean in 2014 and looks at the critical short duration rainfall rain intensities that drive urban flooding. Here is a review that explore that national data in detail, drilling down to Ontario and southern Ontario trends and showing why insurance industry statements on higher weather frequency shifts were exposed to be 'made up' (confusing arbitrary future predictions with past observations):


Citing IPCC is irrelevant in the context of urban flooding in Ontario cities .. IPCC's definition of 'heavy rainfall' is the 95% percentile of daily rain with in Toronto is about 29 mm of rain - that is big for 'climate' but tiny for 'weather'. Typically storms have to be 3 times that big to cause urban flooding and most new communities are designed to handle 100-year design storms with built-in resiliency measures / safety factors to handle larger storms (if we see a hockey stick and get more extreme rain in the future).

Recently I made presentation to the Ontario Waterworks and Water Environment of Ontario's Joint Climate Change Committee on city resiliency and adaptation. In it there is wealth of basic media myth-busting many would benefit from. It includes explanations of why we have more flooding from a quantitative engineering perspective, exploring hydrologic stresses and intrinsic hydraulic design limitations in 50-100 year old infrastructure and land use planning:


It shows for example that 2017 Lake Ontario levels, while above average, were not very extreme looking back at 100 years of record (we exceeded past records by about 5 cm in some months which is naturally what happens with longer and longer records and the updated operating 'rule curves' for the lakes). It shows that the Richmond Hill GO Train was flooded in 1981 (just like 2013) in the exact same spot, even though the Ontario government suggests the 2013 flood was due to climate change. It shows that during the highest short duration rainfall recorded in Toronto in 1962 there was extensive basement and roadway flooding (this is not a new phenomenon at all). It shows numerous studies at the University of Guelph, University of Waterloo and major engineering consultants that Ontario extreme rainfall in decreasing and that extreme rainfall is not coupled to temperature changes. It shows significant urbanization in Oakville, Burlington and the rest of the Golden Horseshoe wince the 1960's and how we have paved up to the upper limit of the Burlington escarpment headwater watershed in that time - its hydrology that explains the increased flooding, not meteorology! This blog post shows the drainage paths in Burlington a little better than the OWWA WEAO presentation at the link above:


These change in hydrology and runoff potential are undeniable and dwarf any noise in the extreme rainfall statistics. The 'new normal' is in fact the 'old extremes' that we have always had .. the system response is more severe however with greater runoff into the same 50-100 year old infrastructure and confined channels along the lower portions of our watersheds. When it comes to urban flooding, only Milli Vanilli 'Blame it on the Rain'. Nobody cares about hydrology. Canada's greatest hydrologist Vit Klemes once lamented about this saying If you have not read it, please see his key note address to International Interdisciplinary Conference on Predictions for Hydrology, Ecology, and Water Resources Management: Using Data and Models to Benefit Society, entitled "Political Pressures in Water Resources Management. Do they influence predictions?"


Basically you could say that today on Ontario it is not unlike the communist Czech Republic that Dr Klemes describes in his address, where predictions (climate change) becomes prescriptions, despite the facts and data. And the media is so far out of touch that we cannot put the
genie back in the bottle and the government is playing along pretending to help solve problems while ignoring true causes.

As our Dr Klemes spoke in Prague:

"[the theorists] find it easier to play trivial scenario-generating computer games while the [managers] find these games much easier to finance... And so by happy collusion of interests, an impression is created that 'something is being done for the future' while the real problems are quietly allowed to grow through neglect of the present"

That is 100% correct. We are ignoring the present risks of today related to hydrology and blaming our flood problems on a climate change computer game (Weather Zoltar if you will). RIP Dr Klemes .. I still remember your guest lecture in our undergraduate class and wish you were around to speak truth to power on this topic.

TVO you have to raise the bar on this topic and demand basic fact checking especially given ECCC statements, corrections by Advertising Standards Canada, CBC Ombudsman, Canadian Underwriters ....

Robert J. Muir, M.A.Sc., P.Eng.
Toronto

***

Recently TVO aired a segment on extreme weather reporting and examined temperatures submitted by a viewer to show that Ottawa maximum temperatures have been decreasing using WeatherStats.ca data. See broadcast: https://www.tvo.org/video/climate-accuracy-activism-and-alarmism, and the transcript: https://www.tvo.org/transcript/2550125/climate-accuracy-activism-and-alarmism. This chart was questioned:


The TVO panelists could not comment on the source of the chart and dismissed it (even through the viewer had supplied TVO with the source). One panelist presented a chart on average temperatures (not maximum values) over a shorter period and seemed to imply that any Ottawa trends were an anomaly. Here is that chart:


What does the TVO panelist chart miss? Maximum temperatures. The hot decades in the early 1900's. The following chart is based on Environment and Climate Change Canada's homogenized and adjusted data - they do not produce annual maximum daily temperatures so this picked the highest daily temperatures for each year, just like the TVO viewer charted using WeatherStats.ca data. Here is the official data maximums:


Note: title station number is 61005976 is corrected (previous version indicated 6105967) - May 7, 2022

There is the same pattern and decreasing trend that the TVO panels dismissed! Maybe instead of inviting just lawyers and doctors as its panelists TVO could invite some engineers to comment on data that is most relevant to our profession?

The following chart shows that for all Ontario stations with trend data available summers are not warming as much as the winters - and Octobers are getting colder.


In Ottawa, data from the Ontario Centre for Climate Impacts and Adaptation Resources shows winter temperatures increasing, driven by the minimum increasing (as noted in a previous post):


Winter temperatures have increased with climate change - Ottawa, 1939-2016

Yet summer maximum temperatures have not increased at all (centre chart) - the mean (left chart) is increasing due to the minimum (right chart) increasing:


Other locations across Ontario have decreasing annual maximum temperatures since the 1930's as well. In Toronto the moving average 30 year annual maximum temperatures have decreased since the 1920's - the periods including the 1930's had high maximum temperatures:

Note: legend updated label series May 7, 2022

Some Toronto temperatures changes may be explained by urban heat island (UHI) effects, meaning heat is absorbed by urban structures and surfaces, and is stored and radiated back. Research at the University of Toronto has suggested that UHI explains a portion of the temperature increase by comparing trends with other rural climate stations not affected by UHI (see Tanzina thesis 2009). Tanzina summarized trends in temperatures by season showing that summer warm days decreased at many Toronto-area stations (highlighted climate stations):


What about across Canada? Other major cities such as Calgary have had decreasing annual maximum temperatures trends as well. This chart shows data from weatherstats.ca which no increase in maximum temperatures:


Environment and Climate Change Canada's homogenized and adjusted data for Alberta show a trend similar to Ontario, meaning warmer mean temperatures due mostly to warmer winters and not summers. These are mean temperature trends by month:


So summers are slightly warmer considering the mean and warmer minimums. But the maximum temperatures in summer (July) have DECREASED, and so have October and November maximum temperatures:


So the month with the highest temperatures is having a decrease in maximum temperature. The chart at right shows climate normals for Calgary, with July temperatures being the highest. This is good news that maximum temperatures in the hottest month are declining according to the official national climate datasets.

Ross McKitrick found some similar trends looking across Canada: https://www.rossmckitrick.com/uploads/4/8/0/8/4808045/temp_report.pdf

Some of his take-aways:

"4. Over the past 100 years, warming has been stronger in winter than summer or fall. October has cooled slightly. The Annual average daytime high has increased by about 0.1 degrees per decade. 72 percent of stations did not exhibit statistically significant warming or cooling.

5. Since 1939 there has been virtually no change in the median July and August daytime highs across Canada, and October has cooled slightly."

***
How about a look at July maximum temperatures in the Toronto area? Are summers getting hotter?

The adjusted and homogenized data are available from Environment and Climate Change Canada: https://www.canada.ca/en/environment-climate-change/services/climate-change/science-research-data/climate-trends-variability/adjusted-homogenized-canadian-data.html

To review, follow the "Surface air temperature" link and download the monthly data, i.e., the file Homog_monthly_max_temp.zip that includes all station data. The data can be evaluated to show trends over 100+ years in several cases.

The following chart shows the maximum daily temperatures in July, averaging all days, for climate stations in Welland, Vineland, Hamilton, Toronto, Peterborough and Belleville including records up to 100 years (2019-2018):

Toronto Maximum Temperatures Climate Change


The Station IDs and names are as follows: 6139148,VINELAND; 6166415, PETERBOROUGH; 6158355, TORONTO; 6139449, WELLAND; 6150689,BELLEVILLE; and 6153193,HAMILTON.  Three stations have decreasing temperature trends and three have increasing trends. On average, over 100 years, the maximum July temperatures have increased by 0.17 degrees Celsius for these six stations.


Radical Transparency. Uncovering the 'big secrets' in urban flood risk adaptation and extreme rainfall trends under climate change in Southern Ontario.

"Truth and untruth exist at the same level of authority on the internet."
Salman Rushdie, on Fareed Zakaria GPS, September 17, 2017

"Only the small secrets need to be protected. The big ones are kept secret by public incredulity."
Marshall McLuhan

Too bad. Lets expose the big secrets in flood risk management and climate adaptation, and give truth the upper hand, shall we?

Lets encourage "radical transparently". Why? So that we can create data-driven, evidence-based policies to cost-effectively manage flood damages and reduce risks to people and property.

This radical transparency is promoted by Ray Dalio, founder of Bridgewater Associates (see his Ted Talk here on successful investing and company building). Dalio says that to be successful we need to "bet against the consensus" and "be right".

The presentation below on the key drivers for managing flood risk in Southern Ontario goes against the consensus in terms of extreme weather extremes (showing they are down not up) - but its not a bet, but rather a careful review of data - so in that regard I trust it is 'right' .... or certainly right-enough for its intended purpose given all the other uncertainties in hydrology and hydraulic disciplines.


Ray Dalio in his Ted Talk shares his painful "Fail Forward" moment of ruin and how he used the experience to improve his decision making. He said "Rather than thinking 'I'm Right', I started asking myself 'How do I know I'm Right?' I gained a humility I needed in order to balance with my audacity. I wanted to find the smartest people who would disagree with me to try to understand their persepctive or to have them stress test my perspective. I wanted to create an idea meritocracy ..."

Let me know your thoughts. I welcome any 'stress test' of my OWWA WEAO Joint Climate Change Committee presentation above. Thank you so much!

R. Muir

Less Extreme Short Duration Rainfall in Kitchener-Waterloo - IDF trends do not show climate change impacts that would affect urban flooding.

The University of Waterloo civil and environmental engineering department analyzed design rainfall intensity trends - that is intensity-duration-frequency (IDF) statistics used in infrastructure design - with the goal of potentially updating City of Kitchener and City of Waterloo design rainfall values. Why do this? Because climate change is predicted in some models to increase the intensity and frequency of extreme rainfall. Results are in the following report:

Update of Intensity-Duration-Frequency (IDF) Curves for the City of Waterloo and the City of Kitchener Prepared By: Donald H. Burn, Ph.D., P.Eng. Department of Civil and Environmental Engineering University of Waterloo, August 2012.

The executive summary states there is no significant change and some decreasing trends for short duration rain intensities - that is, the design parameters that affect urban infrastructure flood risks:

"Annual maximum rainfall data for durations ranging from five minutes to 24 hours were analyzed for trends using the Mann-Kendall non-parametric trend test. Although no statistically significant trends were identified, there were noticeable patterns in the magnitude and direction of the trends in the rainfall data, as a function of the rainfall duration. Based on the available rainfall data for the period 1971 to 2007, new intensity-duration-frequency (IDF) curves were developed for the Waterloo Wellington A climate station; the curves can be used as IDF curves for the City of Waterloo and the City of Kitchener. The Pearson Type III (PE3) distribution was identified as the preferred distribution function for the data and formed the basis for estimating the quantiles required to form the IDF curves. The rainfall intensity values for the new IDF curves tend to be lower than the corresponding values for the existing curves for rainfall durations of up to one to two hours and generally slightly higher than the rainfall intensity values for the existing curves for the longer rainfall durations. The results indicate that the existing IDF curves for the City of Waterloo and the City of Kitchener are likely somewhat conservative for rainfall durations less than two hours, although the impacts of climate change could result in more severe events in the future."

The University of Waterloo findings are consistent with the 'general lack of detectable trend signal' in past rainfall observations as reported by Environment and Climate Change Canada (ECCC). ECCC reported even some regional decreasing trends (St. Lawrence region of southern Quebec and the Atlantic Provinces) for the short duration intensities affecting urban drainage systems:

Trends in Canadian Short‐Duration Extreme Rainfall: Including an Intensity–Duration–Frequency Perspective Mark W. Shephard, Eva Mekis, Robert J. Morris, Yang Feng, Xuebin Zhang, Karen Kilcup & show all Pages 398-417, Published online: 19 Nov 2014 (Atmosphere-Ocean).

What do the University of Waterloo findings look like? These intensity-duration curves for 5-year, 25-year and 100-year rain frequencies show that for duration less than 2 hours, the storm severity has been decreasing:

IDF update climate change Kitchener Waterloo 5 year
IDF update to assess climate change impacts for sewer design shows decreasing 5-year rainfall intensities for durations less than 120 minutes (2 hours) - small flashy urban drainage systems now have lower extreme rainfall risk than with previously higher rainfall. Therefore earlier designs using older, higher rainfall design intensities have a safety factors against extreme weather risks for frequent events, and climate change has not adversely affected Kitchener-Waterloo erosion risks or erosion damage potential (erosion risks are often governed by frequent storm stresses). 

IDF update climate change Kitchener Waterloo 25 year
IDF update to assess climate change impacts for sewer design shows decreasing 25-year rainfall intensities for durations less than 90 minutes (one and a half hours) - small flashy urban drainage systems subject to nuisance flooding now have lower extreme rainfall risks. Therefore earlier storm drainage designs using older, higher rainfall design intensities, have a safety factors against extreme weather risks, and climate change has not adversely affected Kitchener-Waterloo flood risks or damage potential. Wastewater systems that have extraneous flow stresses (i.e., inflow and infiltration) and that respond to short duration rainfall appear to have lower capacity stresses with climate change IDF update. A Class Environmental Assessment Master Plan study in Kitchener has shown that peak wastewater flows in the trunk systems (e.g., Ottawa, Manchester, Montgomery trunks) are most highly correlated to short duration rainfall intensities. A Class Environmental Assessment study of the Sandrock Greenway trunk has also shown that smaller local wastewater systems respond to short duration rainfall intensities, even without high inflow potential in catchments with fully and partially-separated foundation service catchments).

IDF update climate change Kitchener Waterloo 100 year
IDF update to assess climate change impacts for sewer design shows decreasing 100-year rainfall intensities for durations less than 90 minutes (one and a half hours) - small flashy urban drainage systems now have lower extreme rainfall risk today compared to previously higher intensities. Therefore earlier designs using older, higher rainfall design intensities have a safety factors against extreme weather risks for rare storm events, and climate change has not adversely affected flood risks or flood damage potential. 

 Why do derived IDF values decrease? Because the observed maximum rainfall amounts in the Annual Maximum Series (AMS) have been decreasing. The following two graphs show trends in annual maximum rainfall recordings from 1971 to 2007. The 5-minute duration maximum rainfall has been decreasing and the 2-hour maximum rainfall have been flat - it is over this range that IDF intensities have been shown to be decreasing n the earlier graphs.


***
Comparing University of Waterloo analysis with politician statements:

Prime Minister Justin Trudeau recently stated "We are a government grounded in science". If so, why has he stated that 100 year storms may occur every 10 years or sooner following 2017 flooding in Gatineau? There is no data to support the storm frequency statement made by the Prime Minister.

Comparing University of Waterloo analysis with insurance industry statements:

The insurance industry, interested in flood damages and the effect on business activities, has stated that storms that happened every 40 years are now occurring every 6 years. Environment and Climate Change Canada has clearly refuted this frequency shift, most recently in Canadian Underwriter saying its studies do not support the insurance industry statement. As noted in the recent article:

"Associate Editor’s Note: In the 2012 report Telling the Weather Story, commissioned to the Institute for Catastrophic Loss Reduction by the Insurance Bureau of Canada, Professor Gordon McBean writes: “Weather events that used to happen once every 40 years are now happening once every six years in some regions in the country.” A footnote cites “Environment Canada: Intensity-Duration-Frequency Tables and Graphs.” However, a spokesperson for Environment and Climate Change Canada told Canadian Underwriter that ECCC’s studies “have not shown evidence to support” this statement."

The following detailed review of insurance industry statement and comparison with Environment and Climate Change Canada's Engineering Climate Datasets clearly shows how the insurance industry has confused projected rainfall intensity shifts with trends from past observations:


Climate Adaptation in the Age of Weather Zoltar (A Short Story on Water Infrastructure Design Limitations and Uncertainty)

What if a "Weather Zoltar" machine answered
all our questions on future climate change
conditions - would we know what to do with
that precise detailed data?
 Are our current decision making processes even
sophisticated enough to make use of it?
The pursuit of extreme weather resiliency and climate change adaptation technical tools and planning / management approaches for core public infrastructure requires a broad review of industry practice and commonly held assumptions about adaptation needs that have been held as tenets. Many of the assumptions do not hold up to scrutiny upon review of fundamental economic and technical data. Some assumptions are overly simplistic and do not recognize the diversity of systems and system components in real-world planning and design environment - the diversity is wide, ranging from newer systems with negligible existing or future climate risks due to inherent design safety factors, to older systems with significant existing risks and fundamental physical and economic constraints to adaptation. The review of newer and older systems and their components and their existing and future risks will help focus the identification of knowledge, technical tool and planning / management framework gaps on areas with the highest risk and highest benefits associated with adaptation efforts.


“Do I really look like a guy with a plan? You know what I am? I'm a dog chasing cars. I wouldn't know what to do with one if I caught it! I just do things.” The Joker in The Dark Knight


It is important that engineers don’t ‘just do things’. If they plan to adapt infrastructure systems to any changes in societal requirements, whether environmental or economic, or to modify approaches to planning and design, there should be a sound basis. Unlike Jokers, they don't 'just do things'.


Imagine the car is future climate and weather details, and the engineering and scientific community is the dog. Imagine if future 5 minutes rainfall intensities and temperatures across Canada were now predicted with exact certainty on a fine 10 m grid across Canada out to the year 2100 and all hydrologists, musicians, municipal engineers, and hydrogeologists were all given the complete future data.  What would they do with it? What would be the plan with this new data? Would they have a sound basis to adapt their practice to this data? Evaluating what they would do with this data can help us review assumptions about systems and system components and explore other fundamental uncertainties in planning, analysis and design.


The Hydrologist


The hydrologist could do things with the minute-by-minute future weather data. Like quickly screen for major events and use some coarse existing hydrologic and hydraulic tools to prevent damages with exact military precision. He would aggregate future rainfall data on a broad catchment basis for his existing hydrology models, and silently curse the fact that he has to now load different storms for each catchment (because he feels that it is less conservative that hitting all catchments with the same intensity peak all at once).


The hydrologist would do his first modelling for areas upstream of known river flood hazards, e.g., Special Policy Areas in Ontario that have big historical and exiting weather flood risks. He would use his steady state river hydraulic model to predict floods levels to the centimetre and get the GIS department to plot the flood limits (but not until after they debate the difference between the hydraulic model elevation benchmarks and the GIS digital elevation model benchmarks) and he would then coordinate with emergency services, engineers and utilities to reinforce existing infrastructure components in the predicted floodplains, and safely evacuate residents and businesses well in advance of each event. He may communicate future flood levels to all property owners in the flood zones and using this information, some owners may or may not flood-proof their properties, depending on whether their insurance policy will cover damages and depending on the benefit/cost of flood-proofing efforts.


After the first flood event, it will be revealed from crowd-sourced drone video footage that the hydrologist’s models were not perfect - in fact the hydrologist ‘rounded down’ to AMC II conditions in the hydrology model to predict peak flow, underestimating the actual antecedent moisture before the first flood, instead of the wet-antecedent condition AMC III model which he thought was too conservative. The hydrologist also argued that the hydrologic model was actually calibrated with smaller storms so he never really had a hope of matching actual storm flows for a large event exactly anyway. The hydraulic model was also not perfect. It overpredicted levels in some areas an underpredicted levels in others, even once the actual vs. predicted flow discrepancies were factored out. Underpredicted model levels were later attributed to culvert grates clogged with debris during the flood that raised actual levels in some locations. The hydrologist argued that the model hydraulic model should not be blamed for these operational issues in the real world system. Also, several cars, picnic tables, pedestrian park bridges, and large dumpsters washed into some large urban channels and clogged culvert openings, raising actual flood levels above those predicted. In some ‘flat’ river reaches the hydraulic model underpredicted the flood level because the model incorporated ‘ultimate roughness’ values to characterize the overbank flow areas that were much higher than the existing values. Lastly, operation of a couple small dams may not have occurred exactly as predicted in the model. You win some you lose some.


Some roadways will wash out during the flood and a provincial inquiry would be held to determine who was responsible. Justice Riviere will conclude that in many cases the flood exceeded the design capacity of the roadway and so wash outs could be expected. He’d struggle with the definition of a ‘dam’ because expert witnesses representing municipalities argue that road embankments are not dams. The railway companies would hire the most expert of experts and argue their embankments are not dams either. In the end, Justice Riviere would recommend mandatory screening of roadway embankments for dam safety based on semi-quantitative risk assessment (like Ontario did for Drinking Water Source Protection) to be developed by a group of provincial ministries and newly conceived Flood Protection Boards. We would wait a long time for the regulations, director rules and guidance documents under the new Ontario “Roads are dams. Yes, it’s a ‘Thing’ “ Act.  The hydrologist would retire well before this inquiry was over.


The Musician


The musician would write songs about the drought of 2041-45, rhyming ‘dust’ with ‘rust’, and  the great Flood of ‘67, quietly wishing for an earlier flood year, like one with more long vowel sounds to draw out like ‘49 - or a ‘54 flood, “that would be much better alliteration - flood o’ fifty-four” he mused. Hearing about the upcoming droughts, the musician’s brother would open a successful lawn painting business like they have in Las Vegas.


Municipal Engineers


Municipal engineers would talk to their managers about upcoming training in Banff to attend a 1-month symposium to learn about how to download the new future data sets, how to do statistical analysis on it, and how to consider it in updating design standards. Why Banff? Its beautiful and everyone can go on nice hikes after the sessions of course. And that funny musician who sings about future weather events will be there too for entertainment on the ‘ice-breaker’ opening night. They heard his repertoire includes old stuff like When the Levee Breaks, but a nice acoustic version. Why statistical analysis? Because most undergraduates have limited competence in this and many practitioners do not use statistics, but rather apply simple conservative fixed, deterministic design values in their everyday practice. It would be worthless trying to apply the future data without considering the variability.


Municipal Engineers’ Managers


The municipal engineers’ managers would go to Banff, not the engineers.  The private sector managers would leave staff behind to work and ‘pay the bills’, and public sector municipal engineers would approve their own training requests. When they returned they would know this new future data represented a dilemma and they would hold a meeting of the secret society of municipal engineering managers, cleverly named the “SWMinatti” during an earlier BEvERage-infused meeting. They said it stands for Storm-Water-Management-Is-Never-A-Truly-Tested-Initiative. They laughed but their wives just shook their heads once this was shared at home.  At this special meeting they would discuss how they would ‘come clean’ in the eyes of the public and regulators and dew-eyed engineers-in-training about the ‘real’ state of practice in municipal engineering design and why they had absolutely no appetite for the new, perfect, high resolution, future climate datasets. The future datasets would mean their municipal and stormwater management practice could now be ‘truly tested’.


The municipal engineering managers would meet. They’d initially joke about the “Weather Zoltar” machine that knows all and tells all - and question if it was really predicting accurate temperature and precipitation on a 10 m grid scale across Canada every 5 minutes for the next 84 years? It turns out it was indeed. How? Early on, several GTA conservation authorities got together and made a $20M grant request to confirm the Weather Zoltar predictions and installed high-precision climate stations every 10 metres in a test catchment north of Toronto - the grant request was immediately fulfilled. The total precipitation measurements every five minutes for 2 years of continuous monitoring were within 3 percent of the Weather Zoltar predictions but the extreme rainfall intensities were less accurate given the bias in equipment measurements. So just a minor measurement error. Temperatures were “bang on” to the first decimal except at the stations affected by shading. Weather Zoltar did know all.

Using a napkin, the municipal engineering managers would start a list of the things that they do in planning, evaluation and design that could be shown to be questionable by the Weather Zoltar data (i.e., overdesigned or underdesigned) and the things that would really benefit from the precise future climate and weather datasets. They would start with things they design for new developments and decide on a code for evaluating issues with each. The code “Not a Thing” meaning that the future data would be of little value, and the need for adaptation for the component design was unnecessary. The code “Might be a Thing” meaning some analysis could be pursued to confirm if any adaptation was required:
New Development System and Component
Will Future Weather Datasets Help? / Why? / How?
New Storm Systems

Draft plan lot layouts
No, lots are far beyond river floodplains (no events above Hurricane Hazel freeboard before 2100). Seems reasonable as Pielke has shown decreasing tropical storm frequency and intensity in the US.


Adapting to larger floodplains affecting new development limits - Not a Thing.
Stormwater pond sizing
No, so many uncertainties in the subdivision design that pond blocks are oversized in the draft plan. Plus ponds have spillways with freeboards to handle flows well in excess of current 100-year design.


Adapting new pond sizes for quantity control - Not a Thing.


What might be a Thing? Review design hyetographs for existing weather - if conservative for existing, adaptation to future weather not expected to be a Thing.
Storm sewer sizing
No, pipes flow partially full with today’s 100-year and predicted higher intensities and peak flows will be throttled by inlet control devices. If some enter the storm sewer system (exceed today’s 100 year design flow) it will be accommodated in the freeboard to the basement elevation (basement slab’s 1 m above HGL).


Adapting new storm sewer sizing for basement flood reduction - Not a Thing.
Local culverts
No, they are sized for 10 year events so they will overtop 6 times in their 40 year design life vs 4 times in the old climate. But it is sort of an arbitrary “even number” design return period anyway (as humans evolved with 10 fingers and toes probably and gave us this base 10 number system). If culvert was something critical, with consequences of failure, it would be sized to a higher design standard.


Adapting new small culvert sizing to manage overtopping - Not a Thing.
Storm outfalls
No, they are susceptible to erosion wash-out by the receiving watercourse. Ideally they are set back from the meander belt-width with local connecting channels to limit risk of wash-out. They are often ‘fail-safe’, meaning some headwalls can fall into the creek with little consequence. Knowing future weather could be used to assess different future shear stresses in the creek but there is so much uncertainty in selecting critical shear stresses for reaches, etc. that no different design action beyond common sense set-backs would be followed with the perfect future climate data, imperfect derived flow data, and highly uncertain derived stresses and resulting vertical or lateral migration rates of the watercourse.


Adapting new outfall design to manage wash-out risks with future weather erosion stresses - Not a Thing.


Add changing freeze-thaw cycles to above … even less of a Thing.
Overland drainage sizing (on roadways)
No, these are often very overdesigned for yesterday’s weather. In one example, the ‘Rouge 4A’ subdivision, there were 2 critical overland flow evaluations points in design. At “LP#1” the overland capacity was 3.70 cms, 276% of the 100-year design flow of 1.337 cms. And at “LP#2”, the overland capacity was 1.85 cms, 791% of the 0.234 cms design flow. There is plenty of spare capacity.


Adapting new overland drainage systems to prevent spilling / flooding - Not a Thing.


The engineers agreed that ‘overland flow climate adaptation’ was “not a thing” to worry about due to existing overdesign in the GTA. But agreed that some considerations should be made in SW Ontario where a saw-tooth road grading pattern keeps all the runoff on the road - some sensitivity analysis toward storage in those systems would be worthwhile to see if freeboards are adequate to store more runoff from higher Weather Zoltar events.


What might be a Thing? Check and modify freeboard on-road storage design standards to accommodate future weather.
Storm pumping stations
No, these are not common in the GTA except in SW Ontario they are used to empty ponds or drains when receiving water levels are high. The pump stations operate only under certain conditions. If lake levels or watercourse/municipal drain levels increase, pumps will operate more frequently.


Adaptation of new storm pumping station capacity to future weather - Not a Thing.


What might be a Thing? Review design hyetographs used for pump storage - currently conservative 6-24 hour Chicago events evaluated. Would a future time series of more extreme weather, presuming lake and watercourse levels could be predicted, such that there is a need to change the size of pumps? Or would longer upstream roadway flooding be acceptable (existing 36 hour drawdown period is used for design).


What Is a Thing? Design standards for resilient power supply and back-up capacity should be reviewed, updated as required considering critical features such as some transportation routes, etc (e.g., served by pumping station pumping underpasses).
New Sanitary Systems

Local sanitary sewers
No, sewers are over designed with excessive dry weather peak flow rates and peaking factors and sewers are designed to flow partially full. Limitations with current design include deterministic infiltration and inflow allowances that do not account for extremes. But because extraneous flow stresses in new fully-separated sanitary sewers are limited (100 year I&I rates an order of magnitude below partially-separated system rates) systems have an intrinsic buffer against surcharging and back-up. Also, many municipalities require backwater valves on the sanitary lateral, such that in a rare event,


Adapting sanitary sewer capacity for future weather - Not a Thing.


What might be a Thing? Thorough review of I&I allowances in design. A doubling of current I&I rates may be in order, at least though a check storm? Some case study subdivisions should be evaluated to confirm if this potentially “Is a Thing”. This is required regardless of the future climate data trends.
Sanitary pumping station
Yes, we found a thing foreshadowing even bigger things in existing systems! Pumping stations are designed for dry and wet weather conditions. Like local sanitary sewers, pumping stations are designed with infiltration and inflow allowances that may not reflect today or future weather’s extraneous flows. The consequences of failure are significant in terms of back-ups / flooding or environmental impacts due to overflows/by-passes.


Adapting new sanitary pumping capacity to today’s and future weather - It’s a thing.
Sanitary trunk sewer
No, these are typically deep with no property connections such that existing or future weather extremes do not have consequences in terms of flood or environmental impacts. Dry weather flow rates and peaking factors accumulate in trunk design, resulting in excess capacity compared to conservative design values.


Adapting new sanitary trunk capacity for future weather - Not a Thing.
New Water Systems

Local watermain distribution system
No, fire flow scenarios governs watermain size. While future higher temperatures may increase irrigation requirements and peak hour demands, these do not govern design. If governing demands were to increase as a result of irrigation, demand management would be more cost effective than system upsizing especially given the water quality / public safety issues of oversizing systems and reduced chlorine residuals.


Adapting new local watermain sizing for future weather and irrigation demands - Not a Thing.

So the overall assessment of new development servicing is that storm systems are full of resiliency now and would not require adaptation for future. The municipal engineering manages raised a glass. They decided that system components could be checked with future IDF values, but may not require upsizing if existing safety factors, such as HGL freeboard in storm sewers are adequate and overland capacity remains excessively conservative - someone should get federal funding and do a detailed model of a new subdivision to show this with the future climate data they all agreed. The acknowledged that some components such as pumping stations and ponds designed using hydrograph methods would benefit from a review of design storm distributions to ensure conservative design.

Their overall assessment of new development sanitary systems suggested that design approaches for considering inflow and infiltration should be reviewed to account for existing extreme weather stresses as well as future ones. But in new developments this seems to be a low risk area - new builds do not have infiltration inputs like old ones, nor the inflow ‘pathways’, like downspouts to foundation drains or unmanaged overland inflows. Again, they agreed someone should apply for federal funding to analyze a new subdivision to confirm this so they could put the adaptation question to bed.

All of a sudden, a giant asian carp leaped out of the channel - they were meeting at the Keating Channel Pub & Grill - and ‘took’ out the littlest manager. BAM! Bonked him right in the head. Since he was from a city with mostly new development it didn’t matter that he was now out cold on the patio for the rest of the discussion because his systems seem to be in good shape with a bit of review of safety factors in existing design approaches - it was noted that the University of Waterloo’s Intact Centre for Climate Adaptation was developing a  Flood Resilient Community Design Guideline to identify high level master planning requirements and local storm, overland and sanitary design objectives to limit flooding - engineers could follow a simple checklist to see if they are following this good standard practice approach in their planning requirements in their Official Plans and engineering design standards. If they do this, there is little need to focus further on climate adaptation in new developments.


So the municipal engineering managers would feel pretty good, except for one. He worked in a city with little new development but a lot of old pre-1970’s development and infrastructure built to early limited design standards. His systems included many storm drainage systems built with no overland drainage system, and many combined and partially separated sanitary sewer systems. The managers all agreed that they spend most of their time and effort on these old limited standard systems - these are the ones where there is ongoing litigation or claims regarding system performance and damages. The ‘old development city’ manager said his city was undertaking basement flood management studies in all these old areas, completing remediation projects to upgrade service levels, and undertake billion-dollar strategies for CSO management and operational improvements. He said he saw a great blog that analyzed the historical floods in 2000, 2005 and 2013 and correlated the flood density to the era of construction - so these is a lot of variability within the subset of older systems, with combined CSO systems generally having lower flood risk due to the surcharge relief while partially separated systems have the highest flood density. The manager with a balance of new and old development echoed this observation on diversity, saying he has litigation ongoing for flooding in one old area -never new areas - and all his ongoing storm flood remediation projects are in pre-1960’s areas. All the sanitary I&I reduction efforts focus on the high extraneous flow old areas too - nothing is done in the new developments because when we get 25-year storm, we don’t get calls from new areas. Climate adaptation in new areas is really ‘Not a Thing’.  Bottoms up!

The SWMinatti found another napkin on the next table and started to evaluate the infrastructure components in old, existing developments to see how many things they could find to adapt given the perfect Weather Zoltar data now in hand:


Old Development System and Component
Will Future Weather Datasets Help? / Why? / How?
Old Storm Systems

Storm sewer system
No, systems may be built to 2 year storm capacity, so there are predominantly exiting weather risks. Upgrades to today’s conservative 100-year storm are often ‘maxed-out’ within right of ways meaning bigger upgrades at not always feasible. Some system upgrades are not cost-effective and do not meet the Council approved threshold for implementation funding. Larger upgrades would introduce more utility constraints and expensive relocations, deeper systems with higher marginal costs due to dewatering requirements or more more costly unconventional construction methods. Small marginal incremental benefits of larger upgrades for future weather would have to be measured against high marginal incremental cost, and low benefit/cost ratios. This cost/benefit analysis should be completed against the backdrop that normalized catastrophic losses are not increasing in Canada considering net written premium growth.


Adapting old storm sewer capacity to prevent basement flooding - Not a Thing. Why? Because it’s already a big expensive, constrained thing under existing weather (i.e., when cities upgrade to 100 year level of service for today’s weather).


A spike in catastrophic losses - Not a Thing when GDP growth or premium growth are factored in, suggesting no economic driver to address damages beyond those associated with existing extremes.


What might be Thing? Review design hyetographs for existing weather - if conservative for existing, adaptation to future weather not expected to be a Thing. If not conservative, further upgrades may be revealed to be constrained physically, financially, or from an incremental benefit/cost sense.
Storm outfalls
No, see outfalls under new development. Old outfall siting intrinsically more susceptible to wash-out under either existing or future weather. Rehabilitation / protection required to address existing risk.


Adapting old storm outfalls to future erosion stresses - Not a Thing. Systems are intrinsically highly vulnerable under existing weather due to siting.
Overland drainage sizing (on roadways)
No, see storm sewers above.


What might be Thing? Mapping and managing overland flow paths through existing urban areas to guide infill development risk management. Use JBA Risk 2D overland mapping (GRID format) or readily available provincial conditioned DEM overland drainage features (vector format).
Old Sanitary Systems

Local sanitary sewers
No, see old development storm sewers. Sanitary systems are constrained like storm. Upgrades consider a 25-50 year historical storm design standard. Future weather will not change the historical standard.


What might be a Thing? Review historical design hyetographs for existing weather. Complete cost-benefit analysis to determine if alternative design standard can be justified for more extreme existing weather or future weather.
Sanitary pumping station
No, see local sanitary sewers above.


Standard practice for sanitary pumping station design in an old development with high extraneous flows would include the evaluation of overflow / by-pass devices, and I&I reduction. Peak flows under existing or future weather would not necessarily be accommodated in the pumping station.


Adapting old pump station capacity in a high extraneous flow system - Not a Thing.
Sanitary trunk sewers
No, old development trunk sewers in valleys are often highly susceptible to natural erosion processes, downcutting and lateral migration of watercourses. Significant investments in remediation and protection are ongoing. Key existing challenges are access for ongoing operation and maintenance and lifecycle replacement of features in constrained valleys (property constraints, topography constraints, environmental constraints).


Adapting old sanitary trunk sewers for future watercourse erosion stresses - Not a Thing.  
Regulator weirs
Yes, the operation of regulator weirs could be greatly optimized to minimize CSO’s and/or limiting basement flooding with minute by minute weather predictions.


Well not quite. The city’s hydrologic models even with perfect rainfall inputs, predict peak flows within a range of -10% to +25%, so CSOs could be better managed but perhaps not optimized. Trade-offs between environmental impacts (aquatic habitat, beach closings) and flooding impacts would have to be made, with one objective satisfied at the expense of the other. And some regulators would not be adjustable remotely or in real time.


Adapting sanitary system operation to minimize CSO’s, and/or limit basement flooding could optimized for some components having real time control capabilities is a Thing. Don’t forget though that Weather Zoltar with minute by minute rain predictions is not a Thing, this is fiction.
Real time CSO controls
See above.
CSO management strategy
No, the city’s strategy is already build on a historical continuous period rainfall record that virtually eliminates CSO’s. Modifying the strategy to account for some other future extreme years, seasons or weeks would add considerable expense with marginal benefit compared to baseline CSO elimination with existing weather.


Adapting a CSO strategy that already eliminates CSO’s to future weather - Not a Thing.
Wastewater treatment plant
Yes, perhaps. Presumably, the future gridded 5 minute rainfall could be put in a calibrated model to transform it into precise wet weather flow at the plant to support optimized operations to maximize treatment efficiency and minimize by-passes. But then again, perfect rain data will not yield perfect flow data at the plant anyway - there is so much scatter in the long term GWI flow response to precipitation, and the short term RDII flow response, plus uncertainty with the macro-scale groundwater systems and foundation drainage (aka mysterious “urban karst”) and surface drainage/wastewater system hydraulic interaction driving inflows during extreme weather, or micro scale interactions between surcharged foundation drains, leaky floor slabs and sanitary floor drains.


WWTP management could be marginally improved with perfect precipitation data, but that perfect data will then reveal the uncertainties in the other complex processes (precipitation-extraneous flow transformations and processes that we don’t even have terminology to describe.

The municipal engineering managers put the old development napkin notes down and scooped up the last nachos. The new development city engineer on the patio was still breathing so that was good - they wondered if they may have to cover his part of the bill - not good.

They would sum up the old system adaptation needs observing that old systems have existing capacity limitations intrinsic in their design. They can have very low levels of service - CSOs can occur many times a year, sewer back-ups in most chronic areas can happen for small return periods, never mind extreme events. Fortunately there are large scale programs and projects aimed aimed at remediating existing issues and improving level of service. Unfortunately these improvements also have physical, financial and environmental constraints.  As a result the Weather Zoltar future climate details will not change how these existing issues are managed. Low cost measures like inflow reduction through cost effective downspout disconnection will continue whether future rainfall is more or less extreme. High cost measures, like upgrading storm sewers to convey 100 year events will continue regardless of future weather, and these upgrades will be constrained physically and financially. The CSO management strategy that will virtually eliminate CSOs will continue whether future seasonal rainfall patterns are more or less variable, or have a few more extreme in some years - it is needed for operational purposes as well. Erosion protection for intrinsically vulnerable features like sanitary systems in valleys will continue as well - design is based on conservative practices like taking the recommended armouring size and doubling it due to inherent uncertainties in current design practice and past experience with wash-outs.

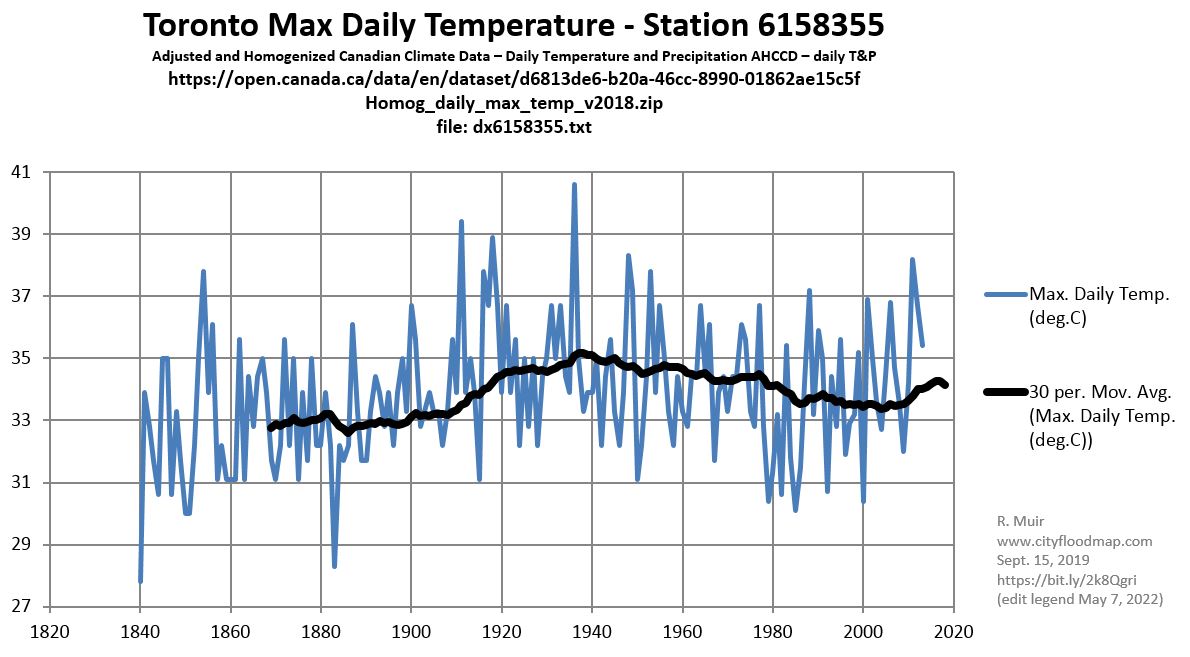
The municipal engineering managers agreed that the fundamental drivers for climate adaptation should be reviewed. They questioned the common belief from their Environment Office staff that storms are becoming more intense or occurring more frequently - Environment Canada’s own Engineering Climate Dataset version 2.3 and their regional analysis of short duration rainfall shows no detectable trends and in some regions the statistically significant trends are downward. There seems to be an ‘availability bias’ in the media and among those with limited scientific background to list a few extreme events and cite this as statistically relevant information to act upon - the engineers agreed that the plural of anecdote was not data and that data-driven, evidence based policies are needed. To test this our they asked the bus boy if he thought storms and flooding were getting worse - he said that he worked at this Keating Channel pub for 4 years and there are a lot of floods on the local roads so yes, it rain must be getting worse - and look at the flood they just had in Windsor. One of the engineers joked that flooding has been happening since the 70’s .. the 1870’s based on the flood inquiry report for the system - the bus boy didn’t get it. They would have to tip well to make up for harassing him. They agreed that someone should get some federal funding to communicate the historical and regional trends data so engineers know if they are in a higher change zone or if their raw weather data needs any safety factors applied to account for intrinsic biases (short uncertain records with sample bias, raw data not corrected/adjusted for daily measurements). That would support engineers in deciding if they need to update IDF curves. One engineer suggested that this could be a reality check for some Environment Office staff who keep citing now-discredited insurance industry rain trend claims - that storms that happened every 40 years are happening every 6 years - that has been shown to be a theoretical shift in a bell curve and not real Environment Canada data as cited.

The municipal engineering managers agreed that the future climate Weather Zoltar data took away one important aspect of uncertainty in infrastructure planning, analysis and design. What it exposed was all the other sometimes more significant uncertainties that go into infrastructure planning, analysis and design like transforming rainfall to runoff given variable antecedent conditions, or transforming rainfall into sanitary inflows or moderate or slow-response groundwater infiltration responses, or water levels in infrastructure and the routing and storage of peaks. Precise exact future climate data allows engineers to put a sharp point on one part a big, blunt instrument called hydrologic and hydraulic modelling. Maybe someone should get some federal funding and demonstrate these uncertainty factors and how they all work together and show that climate uncertainty should be considered along with all the other uncertainties - for what system components is climate important and how can it be readily addressed. After all we only have exact future climate data available to 2100 and after that we have to make some assumptions about how to handle later uncertainties.  

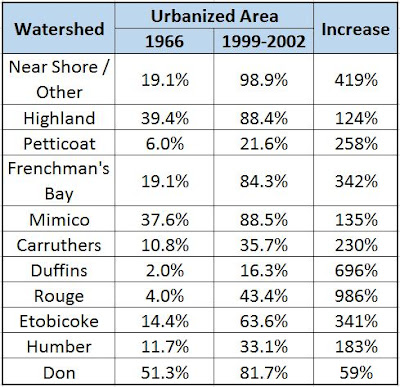
Lastly, the managers agreed that what is really needed is a review of the economic drivers for climate adaptation. Since US data shows tropical storms are less severe and frequent and there is local data on decreasing intensity trends, like from convective storms, there must be other drivers for increasing catastrophic losses. The growth and intensification of urban areas could be reviewed - one engineer suggested his initial GIS analysis showed watershed urbanization increasing 100% a decade compared to research showing peak rain intensities increasing 1-2% per decade. Those drivers have to put into perspective so that remediation actions can be prioritized. Analysis in the US showed flood losses normalized for GDP growth were decreasing - increases could be explained by growth and more insurance market penetration. This means the issues of flooding is still significant, but it is not ballooning out of control such that the investment in existing flood mitigation or future flood adaptation should baloon as well. One engineer shared that he normalized the Canadian catastrophic loss trends from 1990 to 2015 using person property premium totals and there is no normalized upward trend. The economic drivers could be considered as part of comprehensive cost-benefit analysis for infrastructure planning and could help refine budget thresholds currently being placed on rehabilitation projects.

The Hydrogeologists

The hydrogeologist (just one - they don’t have friends to hang with) looked at the infographic that came with the future weather datasets and laughed. “What am I going to do with this? So what if I have the rainfall and temperature data. Yes I want to refine my recharge estimates that drive my groundwater model, but the biggest part of the water balance, the evapotranspiration, is still a great big hairy unknown. My empirical equations are really really rough as it is now. Anyway, before Weather Zoltar, we did a sensitivity analysis on future climate for a really stressed groundwater water supply system. We found that most scenarios gave us more recharge because of more precipitation and less frozen soil and that resulted in increasing groundwater levels at the municipal well. The assumption that climate change would automatically decrease groundwater levels, starve baseflows and necessitate costly infiltration BMPs is really unfounded. The Weather Zoltar data confirms it. I’m always amazed at these municipal engineers - they have these cartoonish representations of water budgets for cities and claimed in the past that urbanization would decrease baseflows - what do we see in our watersheds? - increasing baseflows. The same was predicted for baseflows with climate change early on and now we show that is unfounded. If groundwater levels are going to drop - and I don’t know if they will, I don’t have an evapotranspiration Zoltar, or a perfect representation of the groundwater systems - then just monitor the situation and drill a deeper well if you ever need to. It would be way too expensive to change what we are doing now based on uncertain impacts, even with this perfect Weather Zoltar data. Done.

***

So what do the hydrologists, municipal engineers, and hydrogeologists do when they ‘catch the car’? When they have perfect future climate data to use? They find that they have significant design safety factors in new systems and take the opportunity to look at weather closely and test assumptions on design storms. Some further study is required to confirm these safety factors. They check if their current local or regional IDF data has been trending higher and needs updating. And they realise they could do these things even without the Weather Zoltar data. The also realise they have a lot of other outstanding uncertainties in any planning, analysis and design. Even perfect future climate data does not help address uncertainties in processes resulting from climate data (e.g., water balance losses, runoff and infrastructure flows). In old systems there are significant physical and financial constraints under existing conditions such that future weather may not change their strategies significantly. Robust cost-benefit analysis as part of multi-objective risk-based decision making is therefore required to guide any adaptation measures that would increase infrastructure investment considering climate impacts. This analysis should consider some decreasing regional trends in extreme rainfall and relatively ‘flat’ trends in losses relative to economic growth and insurance premium growth.

(c) R.J.Muir, Toronto - 2017


PS - today there is a considerable amount of effort prognosticating about future intensity-duration-frequency curves - what will they be? Unfortunately this is not converging. The questions we should be asking is what if you knew what they would be exactly ... or better yet what all future rain patterns would be? The possible answers in the Weather Zoltar story show us that once you know the exact future rain, you would have to face the reality that you have wide uncertainty on the next steps in applying rainfall data, whether in deriving a synthetic 'design' storm from that IDF data (rain statistics become simulated storm), or a hydrology transformation (simulated rain storm becomes runoff) or a hydraulic simulation (simulated runoff becomes infrastructure flow), and that a fulsome economic framework does not exist for decision making related to infrastructure investments as a function of system performance (e.g., flood damage losses, environmental issues, etc.... i.e., simulated flow becomes flood depths and potential damages/losses) what is the benefit/cost, what is the ROI, whose benefit? whose cost?. The good news is that most municipalities have a couple decades of obvious remediation work to do based on what we clearly know already about today's rainfall - they should get on with it - the needs are largely in pre-1980's subdivisions with design limitations related to riverine flood risk management (encroachment/enclosure of large channel/watercourses), wastewater system design (high extraneous wet weather flow stresses from foundation drains etc), and storm drainage system design (no explicit major overland flow design, limited minor system / sewer capacity).


Make a wish. All future rainfall details .... if your wish is granted then you'll need a few more arcade machines to predict
how the rain becomes runoff, how runoff becomes infrastructure flow, how flow becomes flood depths, how flood depths
becomes losses, and how to determine the appropriate economic investments in infrastructure to address the issues ... oh,
and another machine to predict future interest rates to support the discount rate in the economic analysis.