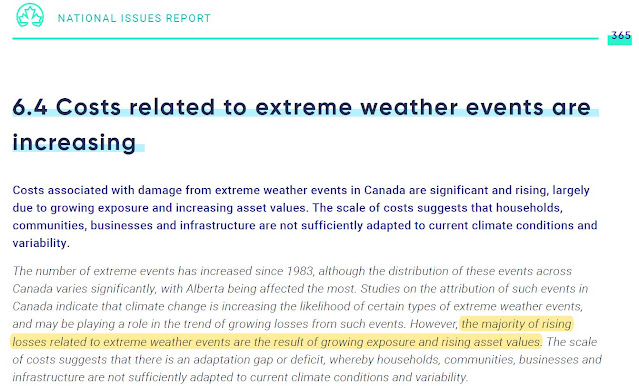
The Canada in a Changing Climate : National Issues report assessed that insured losses in Canada have been increasing since the 1980's and that "the majority of rising losses related to extreme weather events are the result of growing exposure and rising asset values". (see previous post: https://www.cityfloodmap.com/2021/06/national-issues-report-identifies.html)
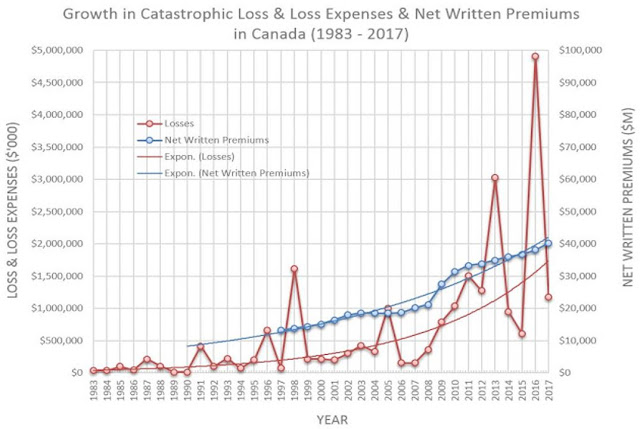
Another previous post illustrated how in Canada losses have increased along with the value of net written premiums, reflected rising asset values: (link: https://www.cityfloodmap.com/2018/05/normalized-inflation-and-growth.html)
Analysis comparing various indicators of exposed assets such as GDP, population, dwelling counts, sanitary and storm sewer length and expected annual damage (EAD) in provinces and regions of Canada will be published in the National Research Council of Canada's upcoming guideline on comprehensive benefit cost analysis for stormwater drainage and flood control infrastructure. The guidelines show the correlation of these indicates with reported losses for perils of Flood, Water, Rain and Storm - the Insurance Bureau of Canada shared available provincial and regional losses from 1983 to 2017 and the authors used this data to derive EAD values for each province.
The chart below illustrates these factors as well as the EAD for provinces and the Atlantic region (aggregated in IBC data).
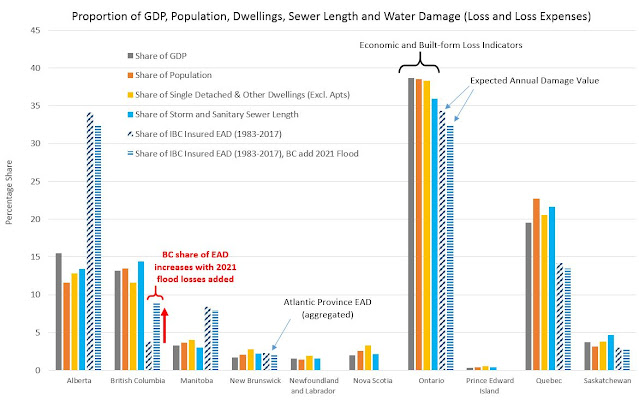
A chart with share of EAD up to 2017 will be published in the NRC benefit cost guideline. Added above is share of EAD including the estimated $450M insured losses for British Columbia flooding in 2021, as reported by IBC (http://www.ibc.ca/bc/resources/media-centre/media-releases/british-columbia-floods-cause-450-million-in-insured-damage). As BC has very low cost per sewer back-up water claim, based on CatIQ data to be published in the guideline, and no significant loss flood events prior to 2017, the share of EAD in BC was significantly below its share of GDP, population, dwelling counts, sanitary and storm sewer length. This may reflect relatively fewer finished basements with exposed assets in BC, compared to other jurisdictions were finished basements are more prevalent (e.g., Ontario).
The Alberta share of EAD was well above its share of GDP, population, dwelling counts, sanitary and storm sewer length, reflecting the significant losses in the 2013 Alberta floods. Factoring in the BC 2021 flood lowers the share of Alberta and other areas' EAD losses slightly but significantly increases the BC share of EAD, putting it more in line with those factors.
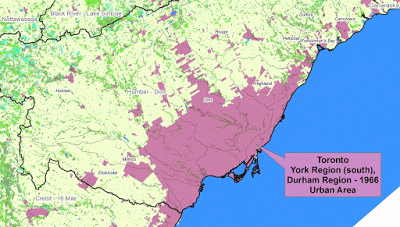
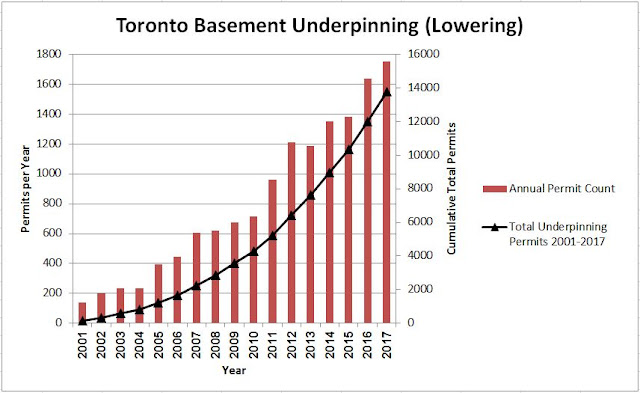
Over time as more 'average' loss years are added to the annual loss series, the share of EAD for Alberta can be expected to decrease, closer to the share of GDP, population, dwelling counts, and sewer length. Ontario EAD is not dominated by isolated significant flood events, but has a high steady occurrence of sewer back-up/water damages in urban centres with multiple high damage events since the early 1980's. As urbanization has increased significantly in many municipalities (see previous post: https://www.cityfloodmap.com/2016/08/land-use-change-drives-urban-flood-risk.html) damages in Ontario are expected to remain close to its share of assets, i.e., damage indicators.